Unlock a world of possibilities! Login now and discover the exclusive benefits awaiting you.
- Qlik Community
- :
- Forums
- :
- Analytics
- :
- New to Qlik Analytics
- :
- Re: Set analysis - comparing 2 numeric columns
- Subscribe to RSS Feed
- Mark Topic as New
- Mark Topic as Read
- Float this Topic for Current User
- Bookmark
- Subscribe
- Mute
- Printer Friendly Page
- Mark as New
- Bookmark
- Subscribe
- Mute
- Subscribe to RSS Feed
- Permalink
- Report Inappropriate Content
Set analysis - comparing 2 numeric columns
Hi,
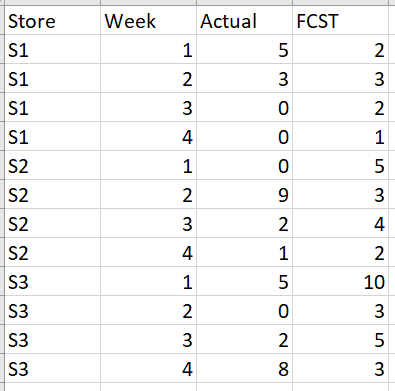
I want to do a set analysis by comparing 2 numeric columns but don't know how to write the syntax.
This is an example of my data:
I want to build a waterfall chart as below:
1st bar: sum FCST where Actual=0 but FCST>0 in last week for all stores (should be 1 in this example)
2nd bar: sum (FCST-Actual) where Actual>0 but FCST>Actual in last week for all stores (should be 2-1=1 in this example)
Can anyone help please? Thank you very much!
- Mark as New
- Bookmark
- Subscribe
- Mute
- Subscribe to RSS Feed
- Permalink
- Report Inappropriate Content
Perhaps this?
1) Sum({<Actual={"=Sum({<Week={$(=Max(Week-1))}>} FCST)=0"}>} FCST)
2) Sum({<Actual={"=Sum({<FCST={"=Sum({<Week={$(=Max(Week-1))}>}FCST)>Sum({<Week={$(=Max(Week-1))}>}Actual)"}>} Actual)>0"}>} (FCST-Actual))
- Mark as New
- Bookmark
- Subscribe
- Mute
- Subscribe to RSS Feed
- Permalink
- Report Inappropriate Content
Thank you for your help! However, both are not working. The first one returns to 0 and the second one has error 😞
- Mark as New
- Bookmark
- Subscribe
- Mute
- Subscribe to RSS Feed
- Permalink
- Report Inappropriate Content
Please share sample data in excel instead image, I will share QVF file for you
- Mark as New
- Bookmark
- Subscribe
- Mute
- Subscribe to RSS Feed
- Permalink
- Report Inappropriate Content
Attached is the sample data. Thank you!
