Unlock a world of possibilities! Login now and discover the exclusive benefits awaiting you.
- Qlik Community
- :
- Forums
- :
- Analytics
- :
- New to Qlik Analytics
- :
- Re: Trafic light dashboard
- Subscribe to RSS Feed
- Mark Topic as New
- Mark Topic as Read
- Float this Topic for Current User
- Bookmark
- Subscribe
- Mute
- Printer Friendly Page
- Mark as New
- Bookmark
- Subscribe
- Mute
- Subscribe to RSS Feed
- Permalink
- Report Inappropriate Content
Trafic light dashboard
Hi,
I want to create a dashboard in a semaphore/trafic light style.
My source data is:
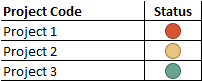
| Project | Status |
|---|---|
| Project 1 | -1 |
| Project 2 | 0 |
| Project 3 | 1 |
Note: -1 is Red, 0 Yellow and 1 is Green
My script:
LOAD
"Project Code",
"Status"
FROM [lib://Projects/projects.xlsx]
(ooxml, embedded labels, header is 2 lines, table is Milestones);
I want to build a dashboard, which would represent my status values in a trafic light, such like this:
Thank you,
FC.
Accepted Solutions
- Mark as New
- Bookmark
- Subscribe
- Mute
- Subscribe to RSS Feed
- Permalink
- Report Inappropriate Content
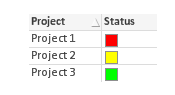
In table, For Status Column , instead of using any image you can set background color to give colors to display it as Traffic light
- Mark as New
- Bookmark
- Subscribe
- Mute
- Subscribe to RSS Feed
- Permalink
- Report Inappropriate Content
Hi
See if attached will help you.
SCRIPT
NoConcatenate
EmpData:
LOAD *
FROM
[..\Data\Test6.xlsx]
(ooxml, embedded labels, table is Sheet1);
Images:
BUNDLE LOAD * INLINE [
ImageID, Path
Red, ..\Data\Red.png
Green, ..\Data\Green.png
Yellow, ..\Data\Yellow.png
];
EXPRESSIOn
=If(Status=-1,'qmem://ImageID/Red',
If(Status=0, 'qmem://ImageID/Yellow',
If(Status=1, 'qmem://ImageID/Green')))
Regards,
Vijay
- Mark as New
- Bookmark
- Subscribe
- Mute
- Subscribe to RSS Feed
- Permalink
- Report Inappropriate Content
In table, For Status Column , instead of using any image you can set background color to give colors to display it as Traffic light
- Mark as New
- Bookmark
- Subscribe
- Mute
- Subscribe to RSS Feed
- Permalink
- Report Inappropriate Content
Thank you for your usefull response.