Unlock a world of possibilities! Login now and discover the exclusive benefits awaiting you.
Announcements
Introducing Qlik Answers: A plug-and-play, Generative AI powered RAG solution.
READ ALL ABOUT IT!
- Qlik Community
- :
- Forums
- :
- Analytics
- :
- New to Qlik Analytics
- :
- Two bars in one diagram
Options
- Subscribe to RSS Feed
- Mark Topic as New
- Mark Topic as Read
- Float this Topic for Current User
- Bookmark
- Subscribe
- Mute
- Printer Friendly Page
Turn on suggestions
Auto-suggest helps you quickly narrow down your search results by suggesting possible matches as you type.
Showing results for
Contributor II
2021-12-21
07:34 AM
- Mark as New
- Bookmark
- Subscribe
- Mute
- Subscribe to RSS Feed
- Permalink
- Report Inappropriate Content
Two bars in one diagram
Hello
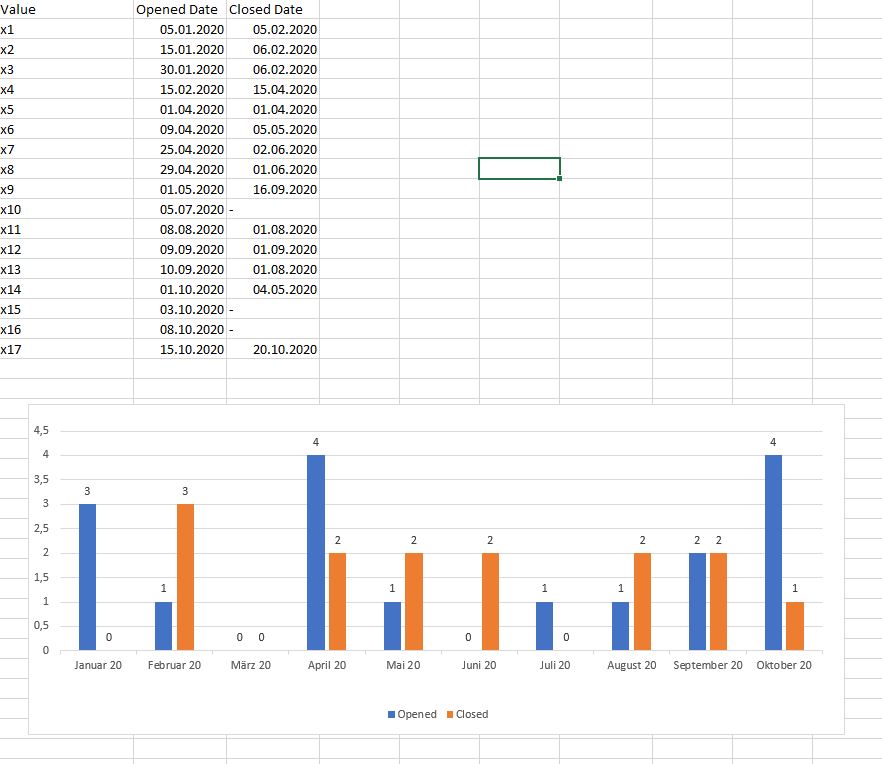
I would like to display the Opened date and Closed date in one chart, with always the number of Value displayed. Where there is no date, it should show zero. See image.
Here are the dates:
| x1 | 05.01.2020 | 05.02.2020 |
| x2 | 15.01.2020 | 06.02.2020 |
| x3 | 30.01.2020 | 06.02.2020 |
| x4 | 15.02.2020 | 15.04.2020 |
| x5 | 01.04.2020 | 01.04.2020 |
| x6 | 09.04.2020 | 05.05.2020 |
| x7 | 25.04.2020 | 02.06.2020 |
| x8 | 29.04.2020 | 01.06.2020 |
| x9 | 01.05.2020 | 16.09.2020 |
| x10 | 05.07.2020 | - |
| x11 | 08.08.2020 | 01.08.2020 |
| x12 | 09.09.2020 | 01.09.2020 |
| x13 | 10.09.2020 | 01.08.2020 |
| x14 | 01.10.2020 | 04.05.2020 |
| x15 | 03.10.2020 | - |
| x16 | 08.10.2020 | - |
| x17 | 15.10.2020 | 20.10.2020 |
I am glad for any support and help.
Thanks and kind regards,
Mizo
443 Views
1 Reply
Contributor II
2022-01-20
09:06 AM
Author
- Mark as New
- Bookmark
- Subscribe
- Mute
- Subscribe to RSS Feed
- Permalink
- Report Inappropriate Content
I have tried all possibilities. Nothing is works. If someone has a path, please help
Unfortunately, it is very difficult to visualize something like this in QLik Sense 😞
346 Views
Community Browser