Unlock a world of possibilities! Login now and discover the exclusive benefits awaiting you.
- Qlik Community
- :
- Forums
- :
- Analytics
- :
- New to Qlik Analytics
- :
- Re: Year plus one
- Subscribe to RSS Feed
- Mark Topic as New
- Mark Topic as Read
- Float this Topic for Current User
- Bookmark
- Subscribe
- Mute
- Printer Friendly Page
- Mark as New
- Bookmark
- Subscribe
- Mute
- Subscribe to RSS Feed
- Permalink
- Report Inappropriate Content
Year plus one
I need to display a measure for "2010" as "2011", "2011" as "2012"....etc.
I have tried this formula (with many variations):
Sum({<Year={$(={Year}+1)} >}my_measure)
but it returns with 0. I would greatly appreciate any assistance.
- Tags:
- yearplusone
- « Previous Replies
-
- 1
- 2
- Next Replies »
Accepted Solutions
- Mark as New
- Bookmark
- Subscribe
- Mute
- Subscribe to RSS Feed
- Permalink
- Report Inappropriate Content
To adapt to ur case Jon Erik:
use a chart, as dimension: Year
as a measure:
sum({<Year>}aggr(below(sum({<Year>}YourMeasure)) , (Year,(NUMERIC, ASCENDING))))
- Mark as New
- Bookmark
- Subscribe
- Mute
- Subscribe to RSS Feed
- Permalink
- Report Inappropriate Content
put as a dimension ur year; and as a measure:
below(sum(my_measure))*avg({<Year>}1)
- Mark as New
- Bookmark
- Subscribe
- Mute
- Subscribe to RSS Feed
- Permalink
- Report Inappropriate Content
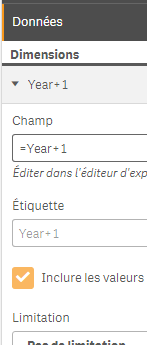
because you are using an aggregation to display the sum of sales or something of a year, i thought about a simple solution you can play just on the visualisation add one year for the year like my example below
and the result on two graphs below one on the left without add the +1 and the other with it
- Mark as New
- Bookmark
- Subscribe
- Mute
- Subscribe to RSS Feed
- Permalink
- Report Inappropriate Content
stalwar1 ; guess from who I copied this technique? haha
- Mark as New
- Bookmark
- Subscribe
- Mute
- Subscribe to RSS Feed
- Permalink
- Report Inappropriate Content
I believe you wanted to do this Omar
below(sum({<Year>}my_measure))*avg(1)
Not sure if the OP needs Above() or Below() or After() or Before(). It will depend on the sorting and pivoting of the year dimensions.
- Mark as New
- Bookmark
- Subscribe
- Mute
- Subscribe to RSS Feed
- Permalink
- Report Inappropriate Content
Hi,
if you select 2010 as year you'd like to get Sum( my_measure ) of 2011 ?
- Mark as New
- Bookmark
- Subscribe
- Mute
- Subscribe to RSS Feed
- Permalink
- Report Inappropriate Content
can't we force the aggregation to be by year ascending? directly in the expression itself?
maybe sthing like:
aggr( below(sum({<Year>}my_measure)) , (Year, ASCENDING))
?
- Mark as New
- Bookmark
- Subscribe
- Mute
- Subscribe to RSS Feed
- Permalink
- Report Inappropriate Content
We sure can ![]()
- Mark as New
- Bookmark
- Subscribe
- Mute
- Subscribe to RSS Feed
- Permalink
- Report Inappropriate Content
If I use this :
aggr(below(sum({<Year>}Sales)) , (Year,(NUMERIC, ASCENDING)))
It does work; but when I select a Year, it correctly bring the correct values, but the other Years disappear!
How can I use this, and keep all the years even when I select a year?
- Mark as New
- Bookmark
- Subscribe
- Mute
- Subscribe to RSS Feed
- Permalink
- Report Inappropriate Content
Found it :
sum({<Year>}aggr(below(sum({<Year>}Sales)) , (Year,(NUMERIC, ASCENDING))))
- « Previous Replies
-
- 1
- 2
- Next Replies »