Unlock a world of possibilities! Login now and discover the exclusive benefits awaiting you.
- Qlik Community
- :
- Forums
- :
- Analytics
- :
- New to Qlik Analytics
- :
- Re: a problem about sense storytelling and snapsho...
- Subscribe to RSS Feed
- Mark Topic as New
- Mark Topic as Read
- Float this Topic for Current User
- Bookmark
- Subscribe
- Mute
- Printer Friendly Page
- Mark as New
- Bookmark
- Subscribe
- Mute
- Subscribe to RSS Feed
- Permalink
- Report Inappropriate Content
a problem about sense storytelling and snapshot
Hi everyone,
When I create a storytelling in the sense, if I choose a snapshot, then the data in the snapshot can not be modified. Eg, as the picture shows:
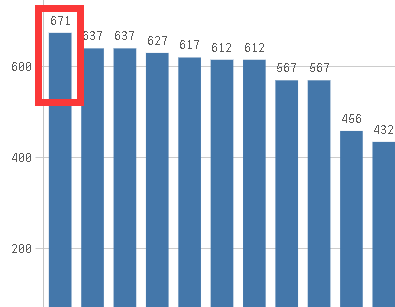
When I take a snapshot for the chart, and I insert it into my storytelling.
But my requirement is : when I export the PPT or PDF, I hope the data is able to adjust. For example, I want the number 671 to become the 670 in the PPT I exported. Of course, I can not modify the data source and model,just become 670 in my PPT, adjust it by hand.
Or another idea?
Thanks.
- « Previous Replies
-
- 1
- 2
- Next Replies »
- Mark as New
- Bookmark
- Subscribe
- Mute
- Subscribe to RSS Feed
- Permalink
- Report Inappropriate Content
Thanks, in this case, we cannot do as this ,In this particular environment, nothing allows us to do this.So I have to think think think about it……And try other way and other tool
- Mark as New
- Bookmark
- Subscribe
- Mute
- Subscribe to RSS Feed
- Permalink
- Report Inappropriate Content
Have you looked at nprinting. it works with qlikview and sense and is used to schedule the generation and delivery of export files in word, excel, PowerPoint and pdf formats. if you use the excel format perhaps you can include adjusts values in the report itself and generate the chart on it rather than using a straight image.
- Mark as New
- Bookmark
- Subscribe
- Mute
- Subscribe to RSS Feed
- Permalink
- Report Inappropriate Content
Thanks for your answering. My first idea is also nprinting in qv.But unluckly, the every sheet includs many charts,and every chart is been combinated with many other objects,for sample, many lines……They are very strict with the style, so it is diffcult to adjust it in PPT.Of course ,if treat the sheet as a whole,then we had to use picture model…… As sense is popular, so I try it in sense...
- « Previous Replies
-
- 1
- 2
- Next Replies »