- Mark as New
- Bookmark
- Subscribe
- Mute
- Subscribe to RSS Feed
- Permalink
- Report Inappropriate Content
color expression for two measures
Hi,
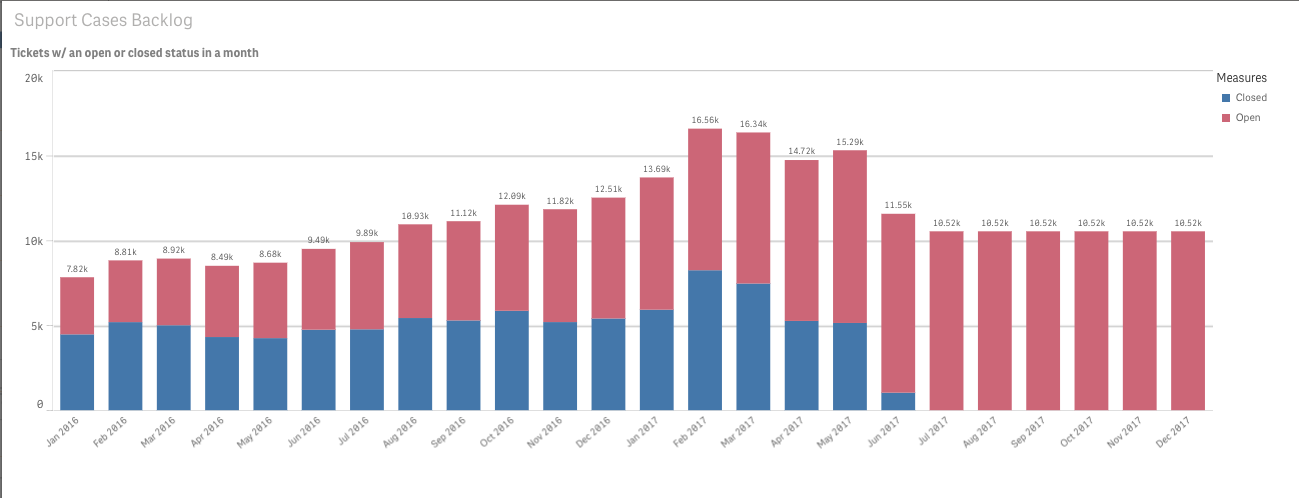
I have a stacked bar chart with two measures that give me the number of open and closed tickets in a given month:

The expression for "closed" is:
Sum(
aggr(
if(month_opened<=_month and (_month<=month_closed or isnull(month_closed) ), 1, 0),
_month,
id
)
)
-
Sum(
aggr(
if(month_opened<=_month and (isnull(month_closed) ), 1, 0),
_month,
id
)
)
And the expression for "open" is:
Sum(
aggr(
if(month_opened<=_month and (isnull(month_closed) ), 1, 0),
_month,
id
)
)
I need to change the color of the open and closed stacked bars, but have not had luck with an if-statement, I think it's because of the use of the aggr function. Any help is much appreciated.
- « Previous Replies
-
- 1
- 2
- Next Replies »
- Mark as New
- Bookmark
- Subscribe
- Mute
- Subscribe to RSS Feed
- Permalink
- Report Inappropriate Content
Hi Mark,
I have Valuelist('Dim1','Dim2') under Dimensions
and for Measures I have
pick(wildmatch(Valuelist('Dim1','Dim2'),'Dim1','Dim2'),
Sum(aggr(if(month_opened<=_month and (isnull(month_closed) ), 1, 0),_month,id)),
(Sum(aggr(if(month_opened<=_month and (_month<=month_closed or isnull(month_closed) ), 1, 0),_month,id))-
Sum(aggr(if(month_opened<=_month and (isnull(month_closed) ), 1, 0),_month,id))) )
for colors I have
pick(wildmatch(Valuelist('Dim1','Dim2'),'Dim1','Dim2'),'#808080','#CF0A2C')
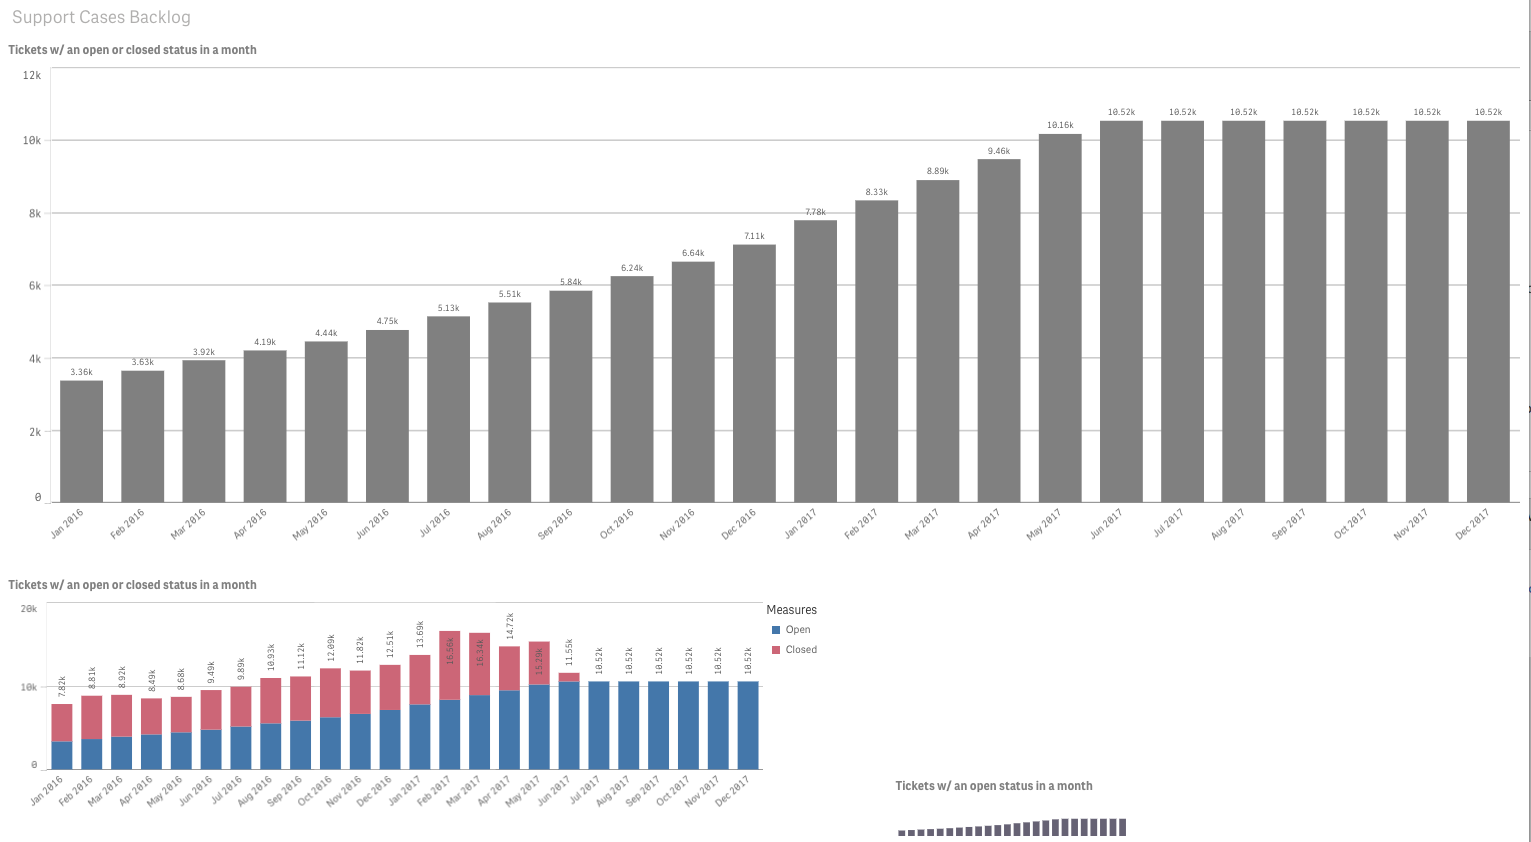
I am only getting a calculation from my first Dim1 expression, not the addition of Dim2. Would you be able to take a look?
- Mark as New
- Bookmark
- Subscribe
- Mute
- Subscribe to RSS Feed
- Permalink
- Report Inappropriate Content
I will take a look and get back to you
- Mark as New
- Bookmark
- Subscribe
- Mute
- Subscribe to RSS Feed
- Permalink
- Report Inappropriate Content
There is something in the expression for your metric that it doesn't like or is not working correctly. I commented out your code and just used this and the colors in the bar chart worked.
pick(wildmatch(Valuelist('Dim1','Dim2'),'Dim1','Dim2'),
1,2)
Have you tried this expression with Set Analysis instead of the If statements?
- Mark as New
- Bookmark
- Subscribe
- Mute
- Subscribe to RSS Feed
- Permalink
- Report Inappropriate Content
Hi Mark,
It looks like the pick(wildmatch(valuelist( expression is only evaluating the first if statement and not the second, when I switch them around it still only evaluates the first. The if-statements work when used as two separate measures. I would take suggestions on how to change around my if statement to work as a set analysis.
Thanks,
- Mark as New
- Bookmark
- Subscribe
- Mute
- Subscribe to RSS Feed
- Permalink
- Report Inappropriate Content
I did this and got the colors to work:
pick(wildmatch(Valuelist('Dim1','Dim2'),'Dim1','Dim2'),
Count ({<$month_closed-={"*"} >} id),
Count ({$<month_closed={"*"} >} id))
So it doesn't like something in your expression and I am not sure. I am not exactly sure what you are trying to do. So maybe you can build on this since you know what you need and you know the data.
- « Previous Replies
-
- 1
- 2
- Next Replies »