- Mark as New
- Bookmark
- Subscribe
- Mute
- Subscribe to RSS Feed
- Permalink
- Report Inappropriate Content
Cumulative Return over dynamic range
Hello all,
I am trying to chart cumulative returns for a portfolio where the user gets to define the date range via a date filter.
My data looks like the table below, the first two columns are my data, the last two is just me showing you what I do in excel and what I'd like to see in Qlik if the user selects Jan 10th as start date.
| Date | CumReturn | CumReturn from 10th | XL Formula |
| 1/2/2018 | -0.10% | ||
| 1/3/2018 | 0.04% | ||
| 1/4/2018 | 0.12% | ||
| 1/5/2018 | 0.91% | ||
| 1/8/2018 | 1.04% | ||
| 1/9/2018 | 1.26% | ||
| 1/10/2018 | 0.67% | 0.00% | ((1+B8)/(1+$B$8)-1) |
| 1/11/2018 | 0.27% | -0.40% | ((1+B8)/(1+$B$8)-1) |
| 1/12/2018 | 0.28% | -0.39% | ((1+B10)/(1+$B$8)-1) |
| 1/15/2018 | 0.37% | -0.31% | ((1+B11)/(1+$B$8)-1) |
| 1/16/2018 | -0.24% | -0.91% | ((1+B12)/(1+$B$8)-1) |
| 1/17/2018 | -0.79% | -1.45% | ((1+B13)/(1+$B$8)-1) |
| 1/18/2018 | -0.71% | -1.38% | ((1+B14)/(1+$B$8)-1) |
| 1/19/2018 | -0.80% | -1.47% | ((1+B15)/(1+$B$8)-1) |
| 1/22/2018 | -1.10% | -1.76% | ((1+B16)/(1+$B$8)-1) |
| 1/23/2018 | -0.36% | -1.02% | ((1+B17)/(1+$B$8)-1) |
| 1/24/2018 | -0.04% | -0.71% | ((1+B18)/(1+$B$8)-1) |
| 1/25/2018 | -0.15% | -0.82% | ((1+B19)/(1+$B$8)-1) |
| 1/29/2018 | 0.26% | -0.42% | ((1+B20)/(1+$B$8)-1) |
| 1/30/2018 | -0.61% | -1.27% | ((1+B21)/(1+$B$8)-1) |
I've tried the following:
sum(CumReturn)/sum({<Date = {"$(=date(Min([DT-Date.autoCalendar.Date]))-1)"}>} TOTAL CumReturn) - sum(1)
from this post: https://community.qlik.com/t5/New-to-QlikView/Dynamic-calculation-of-returns-based-on-selected-dates...
but it does now work and gives me very large values. Any help on correcting this expression to get what you see in column C of my data above if the user selects Jan 10th as start date? What the excel formula does is simply take the current cumulative return and divide it by the one at the start of the selected period, -1. The trick is to 'fix' the start of period date (Min date), and to use only the current cumulative return on each day in the first part of the formula. The above function seems to add the entire cumulative data for the month of January each time.
Much appreciated
Olivier
Accepted Solutions
- Mark as New
- Bookmark
- Subscribe
- Mute
- Subscribe to RSS Feed
- Permalink
- Report Inappropriate Content
Try this
(1+Sum({<Date = {">=$(=Date(Min([Date])))"}>}CumReturn))/(1+Sum({<Date = {"$(=Date(Min([Date])))"}>} TOTAL CumReturn)) - 1
- Mark as New
- Bookmark
- Subscribe
- Mute
- Subscribe to RSS Feed
- Permalink
- Report Inappropriate Content
Hi Olivier -
Not sure how I missed your response, but may be try this expression for your first issue. Basically, I have added the upper limit to the set analysis so that it doesn't go beyond the selected maximum date
(1+Sum({<Date = {">=$(=Date(Min([Date])))<=$(=Date(Max([Date])))"}>}CumReturn))/(1+Sum({<Date = {"$(=Date(Min([Date])))<=$(=Date(Max([Date])))"}>} TOTAL CumReturn)) - 1For the second issue, have you tried to unselect 'Include Zero Values' under Add-on-> Data Handling?
- Mark as New
- Bookmark
- Subscribe
- Mute
- Subscribe to RSS Feed
- Permalink
- Report Inappropriate Content
@odassier wrote:Hi Sunny,
Thanks for that update. Actually your first expression worked fine in the app I created, but it didn't on yours and your new expression does so thanks for that, I'll keep your edit in mind. Do you know how to use the expression in a KPI object to give me the end period CumReturn? this expressions works fine on tables and charts )so long as you can stipulate a date dimension, but in a KPI it simply aggregates all values.
For KPI, try this expression
(1+Sum({<Date = {"$(=Date(Max([Date])))"}>}CumReturn))/
(1+Sum({<Date = {"$(=Date(Min([Date])))<=$(=Date(Max([Date])))"}>} TOTAL CumReturn)) - 1
- Mark as New
- Bookmark
- Subscribe
- Mute
- Subscribe to RSS Feed
- Permalink
- Report Inappropriate Content
Try this
(1+Sum({<Date = {">=$(=Date(Min([Date])))"}>}CumReturn))/(1+Sum({<Date = {"$(=Date(Min([Date])))"}>} TOTAL CumReturn)) - 1- Mark as New
- Bookmark
- Subscribe
- Mute
- Subscribe to RSS Feed
- Permalink
- Report Inappropriate Content
Hi Sunny,
Thanks for your help as always with this. the expression works with regards to the computation of the cumulative return from the start date selected in the filter, but it does not seem to 'obey' the end date of the filter selection. So in your example app, if I select the dates Jan 5-10th only, the table correctly starts with 0.00% cumulative return on Jan 5th, but gives me all the dates after that (i.e. until Jan 30th) and does not stop at Jan 10th. So when I try to build a line chart for cumulative returns between two dates, the charts does not stop at the end date but continues for the full data set.
Any ideas on how to modify the expression to only include the periods selected by the user?
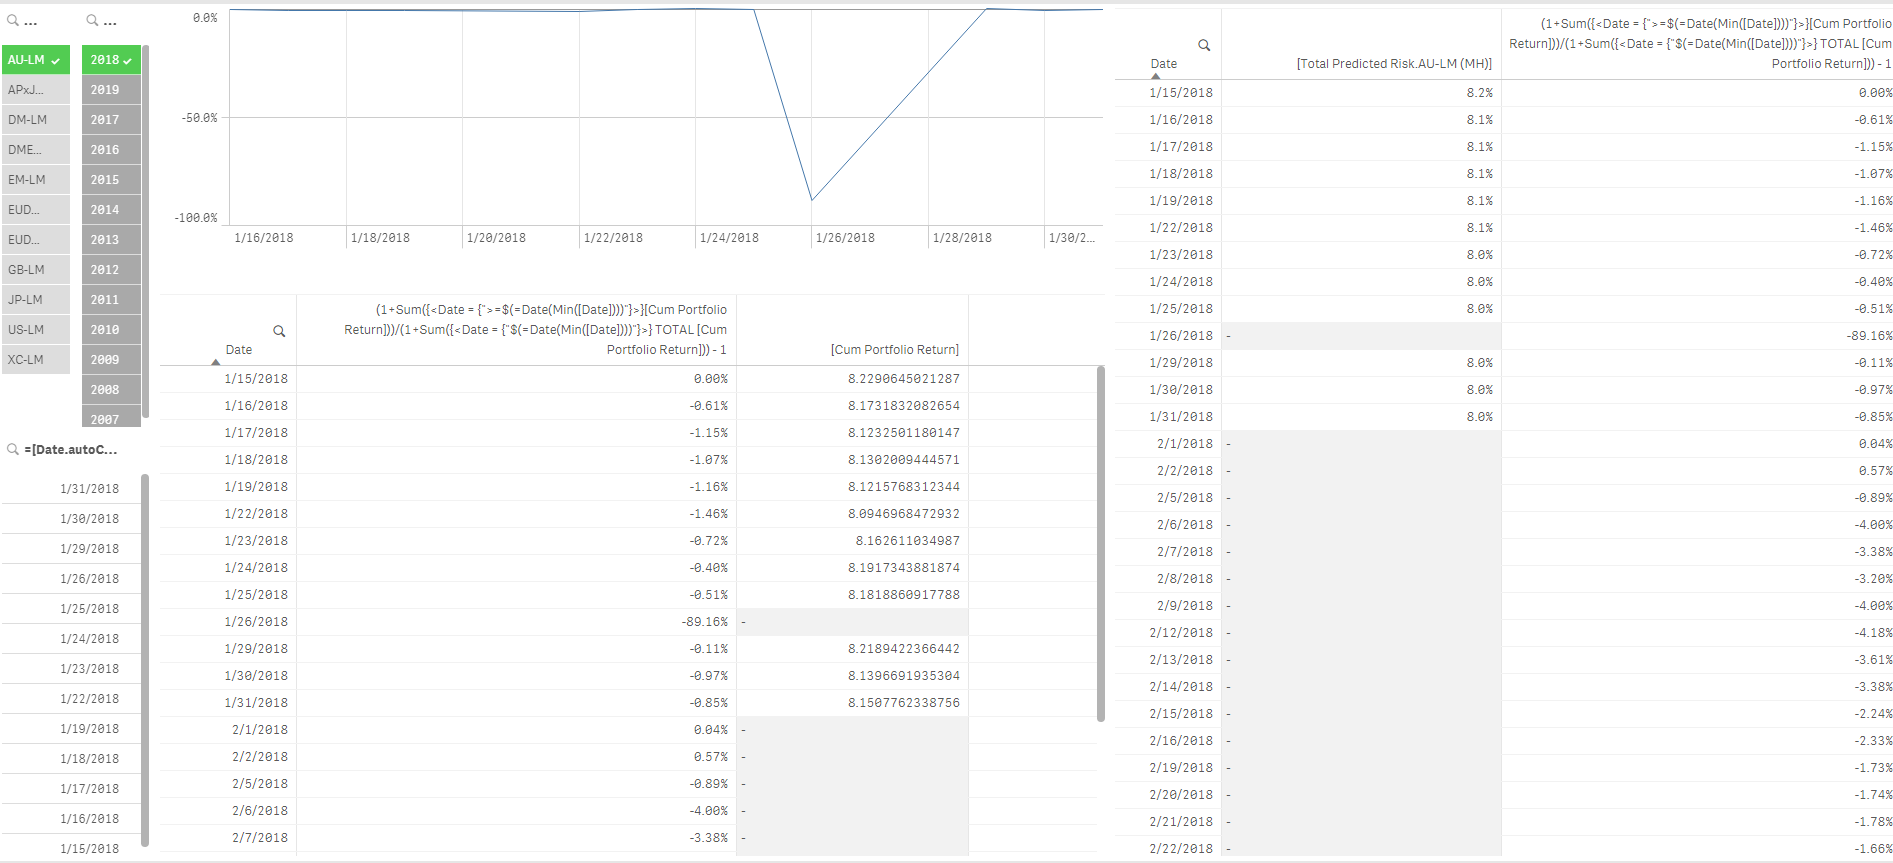
Also, I can't seem to make it skip dates for which there is no data (i.e. market holidays). See attached screenshot for an Australian portfolio when Australia has a market holiday on Jan 26th 2018 so there is no **bleep** return data that date (see the [**bleep** Portfolio Return] column in the tables). On that date, the expression returns a -89.16% instead of omitting the date, which means the chart (see chart above table in attached picture) is also wrong. Any ideas on how to fix that or what causes it?
Thank you.
Olivier
- Mark as New
- Bookmark
- Subscribe
- Mute
- Subscribe to RSS Feed
- Permalink
- Report Inappropriate Content
Hi Olivier -
Not sure how I missed your response, but may be try this expression for your first issue. Basically, I have added the upper limit to the set analysis so that it doesn't go beyond the selected maximum date
(1+Sum({<Date = {">=$(=Date(Min([Date])))<=$(=Date(Max([Date])))"}>}CumReturn))/(1+Sum({<Date = {"$(=Date(Min([Date])))<=$(=Date(Max([Date])))"}>} TOTAL CumReturn)) - 1For the second issue, have you tried to unselect 'Include Zero Values' under Add-on-> Data Handling?
- Mark as New
- Bookmark
- Subscribe
- Mute
- Subscribe to RSS Feed
- Permalink
- Report Inappropriate Content
Hi Sunny,
Thanks for that update. Actually your first expression worked fine in the app I created, but it didn't on yours and your new expression does so thanks for that, I'll keep your edit in mind. Do you know how to use the expression in a KPI object to give me the end period CumReturn? this expressions works fine on tables and charts )so long as you can stipulate a date dimension, but in a KPI it simply aggregates all values.
As for my second issue, it was due to the fact that there is a one-day lag between risk and return data (returns for today are measured only tomorrow). This led to the return line on the top left corner of the first sheet to drop to '0' at the end date. I fixed that by creating an 'if' statement limiting the CumReturn calculation to days where there is a daily return.
But another issue has come up. In my app, all the portfolio (single country and regional ones) files are 'associated' to each other by their 'Date' field. This is so that the user can simply select a date range in the filters and have all the charts react accordingly (not sure this is the best way, just my newbie way of making it happen). The issue is that regional portfolios like Europe, Emerging Markets, Global, Asia, etc. are 'open' on Jan 3rd 2017, but single country portfolios like Australia, US,UK, etc. were not (they only opened on Jan 4th). So if you select 2017 as the start date in the "Year' filter, what you see is that if you select one of the regional markets, the cumulative return line starts from 0% as expected but if you select a single market, say Australia, because it only 'opened' on Jan 4th in 2017, your expression doesn't work and the cumulative line starts where it would have ended on Dec 31 2016 had I selected the full history (i.e. it starts at around +30%). it seems the min date for regional markets trumps the min date for local markets.
I'm not sure how to fix this and it may be an issue I created by selecting the date field as the association across all files? But the data filter would not work unless I did it that way. Any thoughts on whether we can edit your expression to fix this or do I need to redo my association model?
Thank you for your help.
- Mark as New
- Bookmark
- Subscribe
- Mute
- Subscribe to RSS Feed
- Permalink
- Report Inappropriate Content
@odassier wrote:Hi Sunny,
Thanks for that update. Actually your first expression worked fine in the app I created, but it didn't on yours and your new expression does so thanks for that, I'll keep your edit in mind. Do you know how to use the expression in a KPI object to give me the end period CumReturn? this expressions works fine on tables and charts )so long as you can stipulate a date dimension, but in a KPI it simply aggregates all values.
For KPI, try this expression
(1+Sum({<Date = {"$(=Date(Max([Date])))"}>}CumReturn))/
(1+Sum({<Date = {"$(=Date(Min([Date])))<=$(=Date(Max([Date])))"}>} TOTAL CumReturn)) - 1
- Mark as New
- Bookmark
- Subscribe
- Mute
- Subscribe to RSS Feed
- Permalink
- Report Inappropriate Content
@odassier wrote:
But another issue has come up. In my app, all the portfolio (single country and regional ones) files are 'associated' to each other by their 'Date' field. This is so that the user can simply select a date range in the filters and have all the charts react accordingly (not sure this is the best way, just my newbie way of making it happen). The issue is that regional portfolios like Europe, Emerging Markets, Global, Asia, etc. are 'open' on Jan 3rd 2017, but single country portfolios like Australia, US,UK, etc. were not (they only opened on Jan 4th). So if you select 2017 as the start date in the "Year' filter, what you see is that if you select one of the regional markets, the cumulative return line starts from 0% as expected but if you select a single market, say Australia, because it only 'opened' on Jan 4th in 2017, your expression doesn't work and the cumulative line starts where it would have ended on Dec 31 2016 had I selected the full history (i.e. it starts at around +30%). it seems the min date for regional markets trumps the min date for local markets.
It might be easier to help if you can share a sample where we can see this issue.
- Mark as New
- Bookmark
- Subscribe
- Mute
- Subscribe to RSS Feed
- Permalink
- Report Inappropriate Content
Hi Sunny,
Your expression for the KPI worked, thanks. It didn't at first because I actually didn't have any data for the max(date) in the set expression. This is related to my other issue. The app has daily data for multiple markets but not all markets are open at the same time. Take this month for example, because of MLK day in the US on Monday the 21st there is no US market data (but I have other markets like Asia and Australia), the last trading day there was 01/18/2019, but my max(date) is 01/22/2019. This means that my KPIs or charts with a set expression based on max(Data) all show "0.0%" for those markets that were not open on those days, but I'd like them to take the latest value for each market instead.
I tried using 'firstsortedvalue' but couldn't make it work. Is there a way to make Qlik look for the last data and ignore '0.0' values until it finds the last value in that table?
What I need the KPI to do is to return the FirstOderValue of Cumulative Return that is not "0.0%" according to dates in descending order. So starting from the max date, go backwards until you find the first CumReturn value. Right now, using your set expression I 'cheat' by saying take max(Date)-4 days ...
Olivier
- Mark as New
- Bookmark
- Subscribe
- Mute
- Subscribe to RSS Feed
- Permalink
- Report Inappropriate Content
Sorry, working on a similar app and got your chart expression cor cumulative return to work:
((1+Sum({<RR.Date = {">=$(=Date(Min([RR.Date])))"}>}[Signal_FTSE Dev_CumRet]))/(1+Sum({<RR.Date = {"$(=Date(Min([RR.Date])))"}>} TOTAL [Signal_FTSE Dev_CumRet])) - 1)
but when I tried to edit it as you did above for a KPI (as of max([RR.Date]), it returns 0.0%. Here is what I did:
(1+Sum({<Date = {"$(=Date(Max([RR.Date])))"}>}[FTSE Dev_Signal]))/
(1+Sum({<Date = {"$(=Date(Min([RR.Date])))<=$(=Date(Max([RR.Date])))"}>} TOTAL [FTSE Dev_Signal])) - 1
Am I missing something?