- Mark as New
- Bookmark
- Subscribe
- Mute
- Subscribe to RSS Feed
- Permalink
- Report Inappropriate Content
Vertical Reference Lines work around needed
Hello Qlikers,
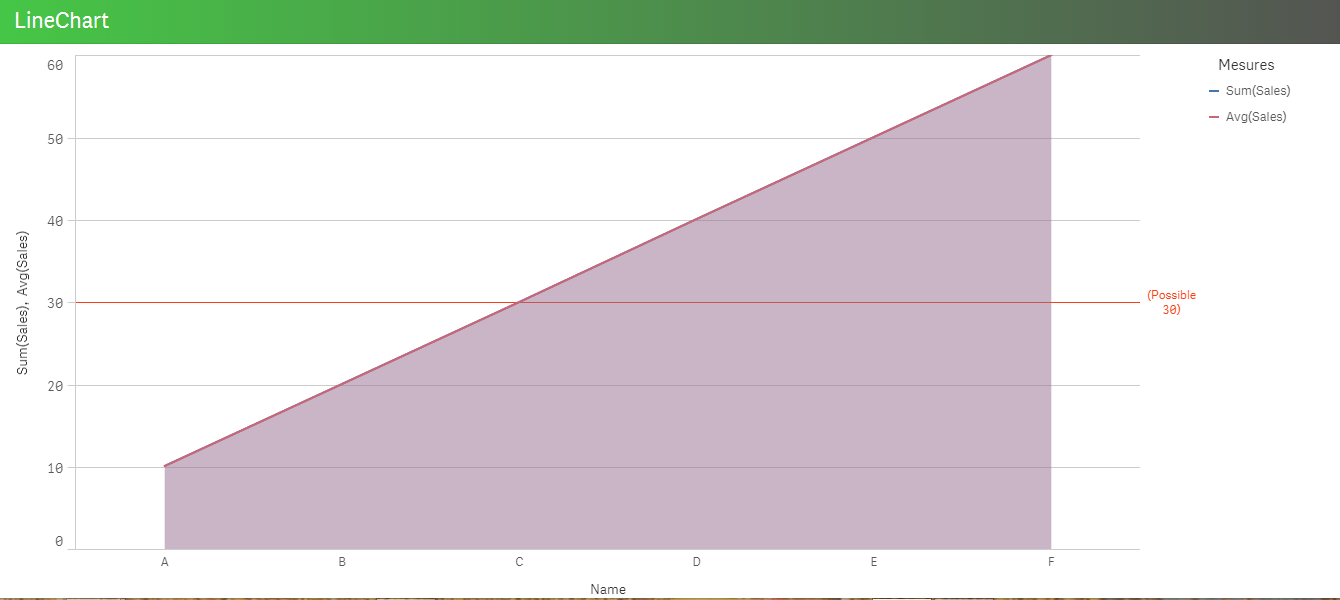
Do we have option to get Vertical Ref line? Sample attached
- « Previous Replies
- Next Replies »
Accepted Solutions
- Mark as New
- Bookmark
- Subscribe
- Mute
- Subscribe to RSS Feed
- Permalink
- Report Inappropriate Content
Finally, Deserve using Native one without Vertical Reference Line and i realized there is some challenges using this box. So, I thought to convey them using Native and fine for them too. The only challenge even native can not be done for 3 Plot areas and One metric using plane line chart. So, We have some work around and achieved that using ARGB() ... So, I am going to close my response only
- Mark as New
- Bookmark
- Subscribe
- Mute
- Subscribe to RSS Feed
- Permalink
- Report Inappropriate Content
Hi Anil:
how do u want ur vertical line chart? and what its point?
Can u explain a little more please?
- Mark as New
- Bookmark
- Subscribe
- Mute
- Subscribe to RSS Feed
- Permalink
- Report Inappropriate Content
Time god, I got one reply atleast.
Well, My intend to show vertical line which based Reference of some condition like we have Qlikview future. I know there is no such future with existing built in with sense. But, Work around may possible. Can we get that?
- Mark as New
- Bookmark
- Subscribe
- Mute
- Subscribe to RSS Feed
- Permalink
- Report Inappropriate Content
the only way I can think of is having vertical bars acting as vertical reference lines...
- Mark as New
- Bookmark
- Subscribe
- Mute
- Subscribe to RSS Feed
- Permalink
- Report Inappropriate Content
That's i have in my mind. Why Can't with extension (Even didn't found anything). Not sure, why VizLib not did that  And just to confirm do we have extension facility?
- Mark as New
- Bookmark
- Subscribe
- Mute
- Subscribe to RSS Feed
- Permalink
- Report Inappropriate Content
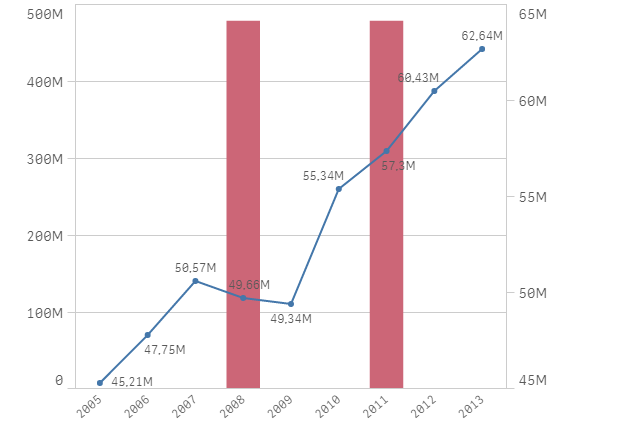
I mean sthing like this:
- Mark as New
- Bookmark
- Subscribe
- Mute
- Subscribe to RSS Feed
- Permalink
- Report Inappropriate Content
Some what we are best with Visualization, So can we do with thin Graph using the same? I mean the width of graph should be decreased Is that done?
- Mark as New
- Bookmark
- Subscribe
- Mute
- Subscribe to RSS Feed
- Permalink
- Report Inappropriate Content
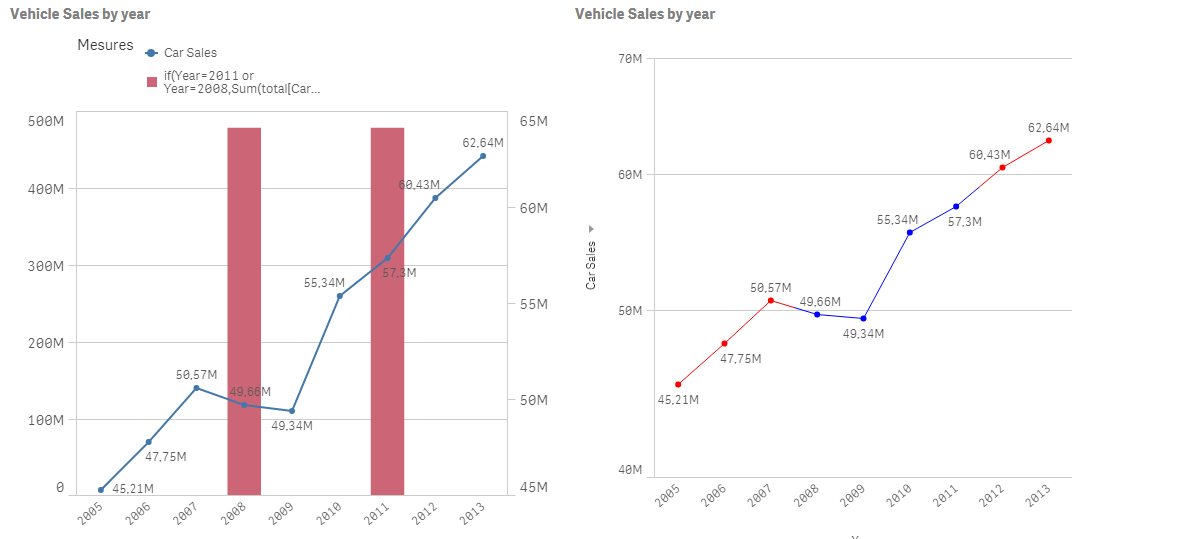
We can"t control the bar width in qlik sense (not yet) and I'm not aware of a combined grpah's extension..
Sorry
- Mark as New
- Bookmark
- Subscribe
- Mute
- Subscribe to RSS Feed
- Permalink
- Report Inappropriate Content
As a work around could you use different colours to denote values before and after your imaginary line or perhaps use a gauge visualisation.
If you can post a screen shot of what you'd like we can guide better.
- Mark as New
- Bookmark
- Subscribe
- Mute
- Subscribe to RSS Feed
- Permalink
- Report Inappropriate Content
I'd prefer the first approach (use of bar chart) instead of coloring the lines; don't u think?
- « Previous Replies
- Next Replies »