Unlock a world of possibilities! Login now and discover the exclusive benefits awaiting you.
- Qlik Community
- :
- All Forums
- :
- QlikView App Dev
- :
- Bar Chart from Straight Table
- Subscribe to RSS Feed
- Mark Topic as New
- Mark Topic as Read
- Float this Topic for Current User
- Bookmark
- Subscribe
- Mute
- Printer Friendly Page
- Mark as New
- Bookmark
- Subscribe
- Mute
- Subscribe to RSS Feed
- Permalink
- Report Inappropriate Content
Bar Chart from Straight Table
I have the following straight table:

All except "Script Number" and "Month-Year Dispensed" are calculated values through expressions. I need to create a bar chart with average (TRx Traffic) on the Y- Axis and Month-Year on the X-Axis. Can this be done and if so, how?
Regards.
- « Previous Replies
-
- 1
- 2
- Next Replies »
- Mark as New
- Bookmark
- Subscribe
- Mute
- Subscribe to RSS Feed
- Permalink
- Report Inappropriate Content
Hi Christopher,
Did you try with Dimension as Month Year and TrxTraffic as Expression in the Bar Chart?
Like
Trx_Traffic:
=Interval(sum(Trx_Time_Dispensed)-Above(TOTAL sum(Trx_Time_Dispensed)),'mm:ss')
Trx_Time_Dispensed - this should be your actual expression used for Trx_TimeDispensed
- Mark as New
- Bookmark
- Subscribe
- Mute
- Subscribe to RSS Feed
- Permalink
- Report Inappropriate Content
Thank you very much Settu
I am getting the following, which is obviously wrong:

My TRx_Time_Dispensed (which is "Time Dispensed" in my expression below is calculated and not loaded inline as in your example. My expression is as follows:
=Interval(sum([Time Dispensed])-Above(TOTAL sum([Time Dispensed])),'mm:ss')
unfortunately i cannot upload the QVW document as it is too big.
Regards.
- Mark as New
- Bookmark
- Subscribe
- Mute
- Subscribe to RSS Feed
- Permalink
- Report Inappropriate Content
Hi,
May be check format of your Time Dispensed Field. Is that date with time or Time only?
Without sample, it is difficult to say. Just Create the sample with Limited Data.
- Mark as New
- Bookmark
- Subscribe
- Mute
- Subscribe to RSS Feed
- Permalink
- Report Inappropriate Content
Thank you, most appreciated.
Time dispensed is calculated as follows:
=Time([Date Dispensed], 'hh:mm:ss')
i will create a sample with limited data.
Regards.
- Mark as New
- Bookmark
- Subscribe
- Mute
- Subscribe to RSS Feed
- Permalink
- Report Inappropriate Content
Hi
Please find attached QVW document. i need to be able to filter with Branch and Year.
Regards
- Mark as New
- Bookmark
- Subscribe
- Mute
- Subscribe to RSS Feed
- Permalink
- Report Inappropriate Content
Hi Christopher,
Try to add the fields (TRx Time Dispensed and TRx Traffic) into your script. Then, it would be easy to do the calculation in the chart.
Like
Load
Your Other Fields,
Time(Interval([Date Dispensed],'hh:mm:ss'),'hh:mm:ss') as TRx_Time_Dispensed,
Interval([Date Dispensed]-Previous([Date Dispensed]),'hh:mm:ss') as TRx_Traffic
From Source;
Check the Attachment.
I used the Avg function in Bar Chart, You can change it based on your need.
- Mark as New
- Bookmark
- Subscribe
- Mute
- Subscribe to RSS Feed
- Permalink
- Report Inappropriate Content
Settu
Thank you very much, i will try it out and advise accordingly.
Regards.
- Mark as New
- Bookmark
- Subscribe
- Mute
- Subscribe to RSS Feed
- Permalink
- Report Inappropriate Content
Hi Settu
Thank you very much, this is the right direction i should take. I have a slight complication which can be seen from the fact table preview below:

A Script (Prescription) can have more than 1 item and the TRx_Time_Dispensed will be the same for the same script. You will see in the above screen shot that we have zero TRx_Traffic in some cases for a prescription with more than one item. This means that the creation of this field during load needs to be adjusted so as to take account of this as a simple 'previous' will give the above resulting in errors during average calculation. There is a need to consider distinct Script Number in calculating TRx_Traffic during script load.
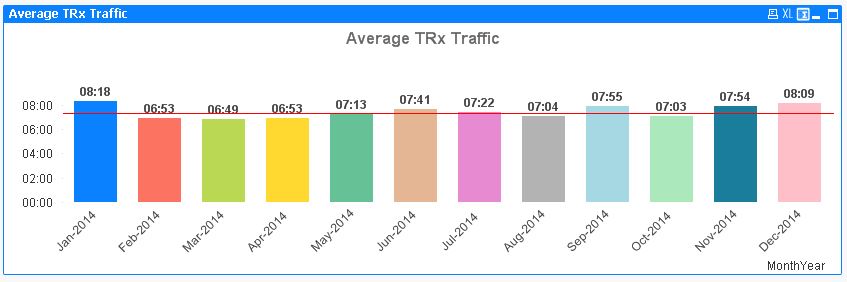
A long solution to this is to export the straight table to Excel and use this as your data source. This is obviously laborious but gives the required results as seen in the chart below.

Is there a way of taking into account distinct Script Number at script load when deriving the field TRx_Traffic?
Regards.
- Mark as New
- Bookmark
- Subscribe
- Mute
- Subscribe to RSS Feed
- Permalink
- Report Inappropriate Content
Hi Christopher,
Yes. i checked it. Some of the Script Number is available in 2 years also.
e.g 129410, 129617 (these entered in 2013 and 2014).
So, just i changed the script, if the Date Dispensed = Previous(Date Dispensed) is true, then we can make it as Null, Else, the Normal Interval Expression.
 if([Date Dispensed]=Previous([Date Dispensed]),'',
        Interval([Date Dispensed]-Previous([Date Dispensed]),'hh:mm:ss')) as TRx_Traffic,
Then, you can use Avg expression.
For me, i'm getting like the below screen shot..
Attached for your reference
- « Previous Replies
-
- 1
- 2
- Next Replies »