Unlock a world of possibilities! Login now and discover the exclusive benefits awaiting you.
- Qlik Community
- :
- All Forums
- :
- QlikView App Dev
- :
- Bar chart to display multiple fields
- Subscribe to RSS Feed
- Mark Topic as New
- Mark Topic as Read
- Float this Topic for Current User
- Bookmark
- Subscribe
- Mute
- Printer Friendly Page
- Mark as New
- Bookmark
- Subscribe
- Mute
- Subscribe to RSS Feed
- Permalink
- Report Inappropriate Content
Bar chart to display multiple fields
Dear Qlikview Experts,
I have this set of data wanted to import from excel.
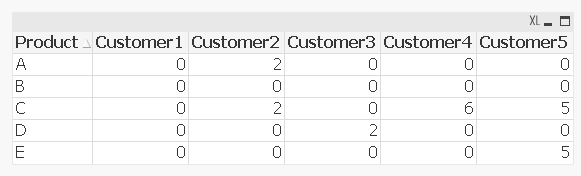
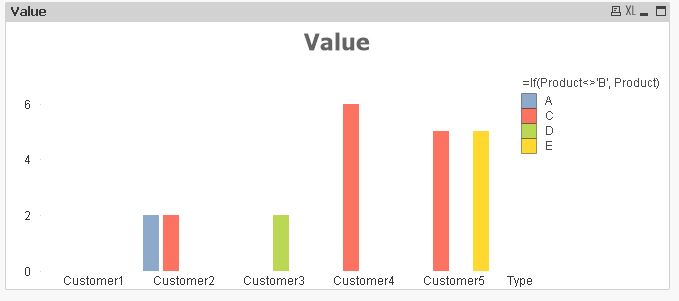
Is it possible for me to create a bar chart with something looks like below?
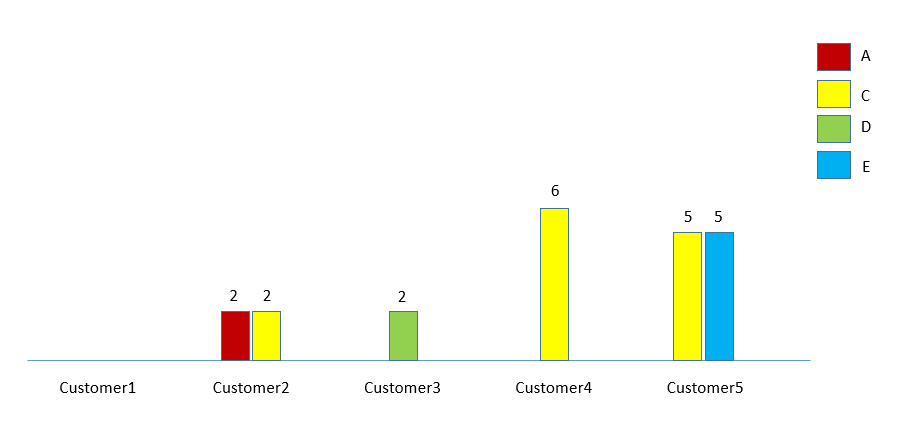
I want to display all products consumed by customers (1-5) but excluding product B.
I had attached sample of qvw and excel file for your reference. Thank you so much for your time!
Best Regards
Accepted Solutions
- Mark as New
- Bookmark
- Subscribe
- Mute
- Subscribe to RSS Feed
- Permalink
- Report Inappropriate Content
- Mark as New
- Bookmark
- Subscribe
- Mute
- Subscribe to RSS Feed
- Permalink
- Report Inappropriate Content
Hi,
sure you can - make a barchart, give it two dimensions - Customer and Product (customer must be the first dimension in order, you'll see) and you'll get groups of bars. You can either filter out Product B in the script, but you probably want to display it somewhere, no? Then you can build some set_analysis into the formul for your bars to exclude product B.
HTH
Best regards,
DataNibbler
Ah - just had a look at your "Testing.qvw", it won't work that way - you obviously have a crosstable there, with the dimension "Customer" across - you have to load it as such or transpose it so that you have one column "Customer", one column "Product" and one "Value" in your resulting table. Then you can make it into a barchart.
- Mark as New
- Bookmark
- Subscribe
- Mute
- Subscribe to RSS Feed
- Permalink
- Report Inappropriate Content
Dear Friedrich,
Couldn't figure out on how to achieve the solution based on your explanation. Are you able to guide me step by step? 
Best Regards
- Mark as New
- Bookmark
- Subscribe
- Mute
- Subscribe to RSS Feed
- Permalink
- Report Inappropriate Content
Dear Friedrich,
The alternative solution that I can think of to achieve similar outcome would be using a straight table chart. However, I have problem in removing columns if that particular customer didn't purchase any products. In this case I would like to remove Customer1 column, how can I achieve that using a straight table chart instead?
Best Regards
- Mark as New
- Bookmark
- Subscribe
- Mute
- Subscribe to RSS Feed
- Permalink
- Report Inappropriate Content
PFA
- Mark as New
- Bookmark
- Subscribe
- Mute
- Subscribe to RSS Feed
- Permalink
- Report Inappropriate Content
Hi Zhang,
You can try this:
1. Load Excel with Cross table to Create Customer as Separate Column:
Table:
CrossTable(Customer,Sales)
LOAD Product,
Customer1,
Customer2,
Customer3,
Customer4,
Customer5
FROM
(ooxml, embedded labels, table is Sheet1);
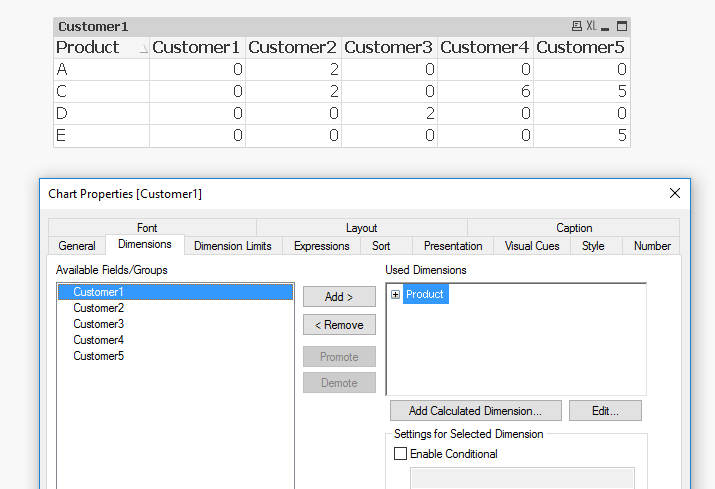
2. Take Customer and Product Dimensions in Bar Chart in this Order: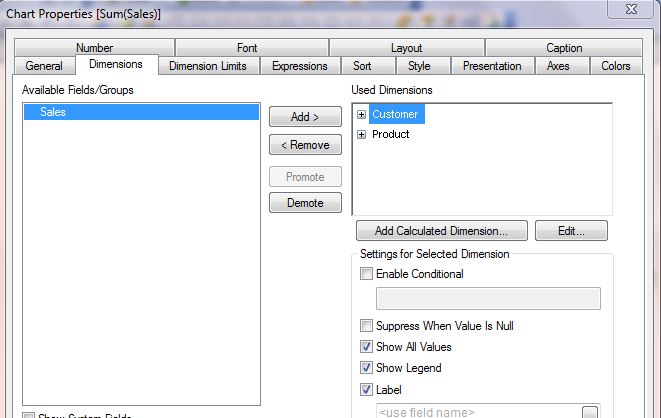
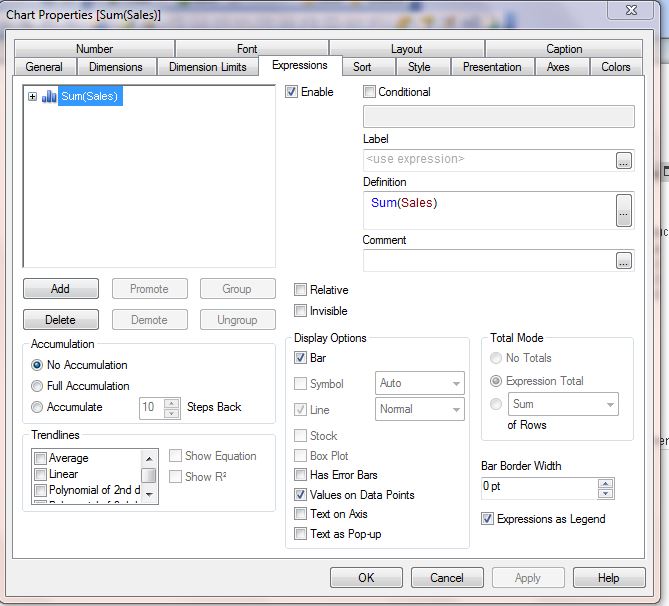
3. Expression: Sum(Sales)
4. Check Values on Data Points check box in Expressions
Hope this helps.
Regards,
Hitesh
- Mark as New
- Bookmark
- Subscribe
- Mute
- Subscribe to RSS Feed
- Permalink
- Report Inappropriate Content
Dear Tresesco B,
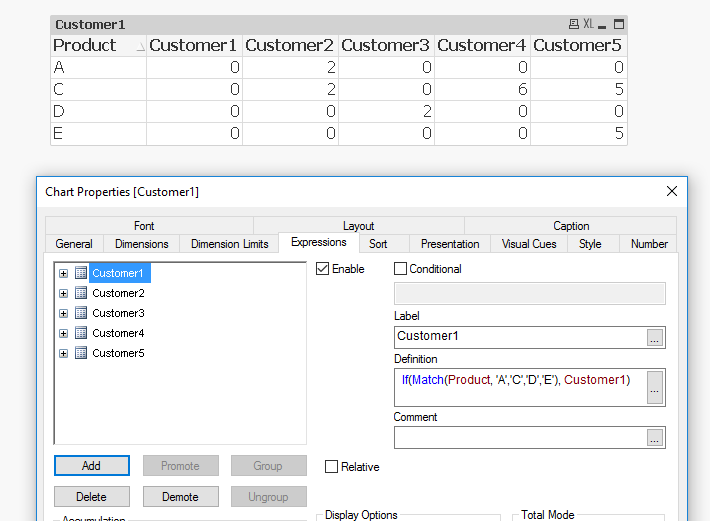
Your solution works perfectly for me, just to clarify with you for the calculated dimension. What is the correct syntax if I want to use " = " instead of "<>" ? So that next time I can made changes of the chart if I just want to show a few specific products.
For example change from : =if(Product<>'B',Product)
For example change to : =if(Product='A' , 'C' , 'D', 'E', Product) ?
- Mark as New
- Bookmark
- Subscribe
- Mute
- Subscribe to RSS Feed
- Permalink
- Report Inappropriate Content
For example change to : =if(Product='A' , 'C' , 'D', 'E', Product) ?
It would be like:
=if(Match(Product ,'A' , 'C' , 'D', 'E'), Product)