Unlock a world of possibilities! Login now and discover the exclusive benefits awaiting you.
- Qlik Community
- :
- All Forums
- :
- QlikView App Dev
- :
- Re: Best 3 Average
- Subscribe to RSS Feed
- Mark Topic as New
- Mark Topic as Read
- Float this Topic for Current User
- Bookmark
- Subscribe
- Mute
- Printer Friendly Page
- Mark as New
- Bookmark
- Subscribe
- Mute
- Subscribe to RSS Feed
- Permalink
- Report Inappropriate Content
Best 3 Average
Hi,
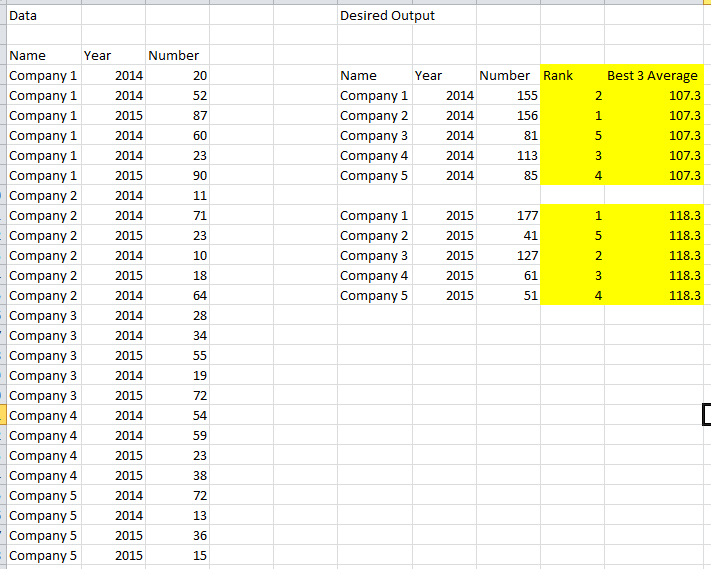
I'm struggling to get a 'best 3 average' formula to calculate and display for all values. I was able to get the total average displaying for all but not the best 3 average. Image shows example data and the desired output. Any help would be greatly appreciated.
- « Previous Replies
-
- 1
- 2
- Next Replies »
Accepted Solutions
- Mark as New
- Bookmark
- Subscribe
- Mute
- Subscribe to RSS Feed
- Permalink
- Report Inappropriate Content
- Mark as New
- Bookmark
- Subscribe
- Mute
- Subscribe to RSS Feed
- Permalink
- Report Inappropriate Content
Please share the excel data sample to try on this? Will save time to build test data.
- Mark as New
- Bookmark
- Subscribe
- Mute
- Subscribe to RSS Feed
- Permalink
- Report Inappropriate Content
Better if we do at Model Level than UI level. Where are you looking to put this logic
- Mark as New
- Bookmark
- Subscribe
- Mute
- Subscribe to RSS Feed
- Permalink
- Report Inappropriate Content
Please share data
- Mark as New
- Bookmark
- Subscribe
- Mute
- Subscribe to RSS Feed
- Permalink
- Report Inappropriate Content
I had thought in the load script but i'm new to qlikview so open to suggestions
- Mark as New
- Bookmark
- Subscribe
- Mute
- Subscribe to RSS Feed
- Permalink
- Report Inappropriate Content
Sample data script:
LOAD * Inline [
Name, Year, Number
Company 1, 2014, 20
Company 1, 2014, 52
Company 1, 2015, 87
Company 1, 2014, 60
Company 1, 2014, 23
Company 1, 2015, 90
Company 2, 2014, 11
Company 2, 2014, 71
Company 2, 2015, 23
Company 2, 2014, 10
Company 2, 2015, 18
Company 2, 2014, 64
Company 3, 2014, 28
Company 3, 2014, 34
Company 3, 2015, 55
Company 3, 2014, 19
Company 3, 2015, 72
Company 4, 2014, 54
Company 4, 2014, 59
Company 4, 2015, 23
Company 4, 2015, 38
Company 5, 2014, 72
Company 5, 2014, 13
Company 5, 2015, 36
Company 5, 2015, 15
];
- Mark as New
- Bookmark
- Subscribe
- Mute
- Subscribe to RSS Feed
- Permalink
- Report Inappropriate Content
What's the logic for best 3 Averages?
- Mark as New
- Bookmark
- Subscribe
- Mute
- Subscribe to RSS Feed
- Permalink
- Report Inappropriate Content
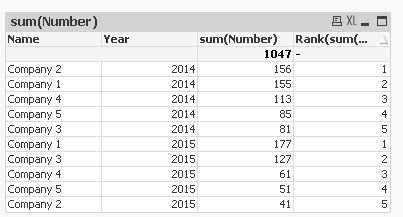
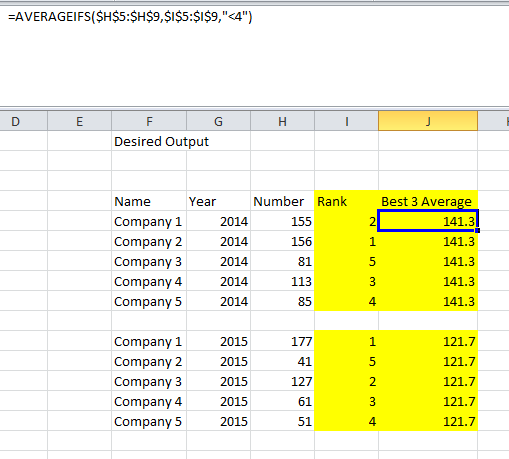
where the rank is <=3, avg(number). In excel I use the AverageIfs function but I cant seem to get it to work in Qlik. Apologies the 1st pic is showing the wrong values.
I want it to display for all companies so that they can see how far away they are from the best 3 average - that's the tricky bit.
- Mark as New
- Bookmark
- Subscribe
- Mute
- Subscribe to RSS Feed
- Permalink
- Report Inappropriate Content
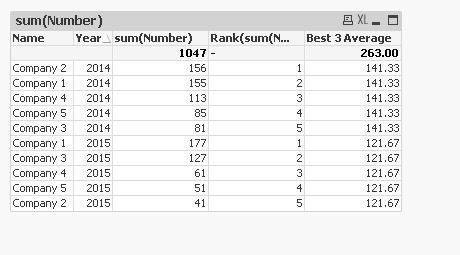
PFA
- Mark as New
- Bookmark
- Subscribe
- Mute
- Subscribe to RSS Feed
- Permalink
- Report Inappropriate Content
Hi, how was this achieved in Qlik? Cheers
- « Previous Replies
-
- 1
- 2
- Next Replies »