Unlock a world of possibilities! Login now and discover the exclusive benefits awaiting you.
- Qlik Community
- :
- All Forums
- :
- QlikView App Dev
- :
- Calculate new customers on front end
- Subscribe to RSS Feed
- Mark Topic as New
- Mark Topic as Read
- Float this Topic for Current User
- Bookmark
- Subscribe
- Mute
- Printer Friendly Page
- Mark as New
- Bookmark
- Subscribe
- Mute
- Subscribe to RSS Feed
- Permalink
- Report Inappropriate Content
Calculate new customers on front end
Hi,
I need to count no. of new customers i.e the customers that came to me for the first time ever, with respect to year and month.
This could be done in script easily but due to some business restrictions (need to calculate new customers with respect to current selections of Brand, Supplier etc.) I need to do this on the front end.
Attached is a subset of the data. Any help is appreciated.
Thanks 
- Mark as New
- Bookmark
- Subscribe
- Mute
- Subscribe to RSS Feed
- Permalink
- Report Inappropriate Content
Hi,
at backend you can simply calculate a flag for custid like in which month the customer is new.. once that is done then use the flag and date range in set analysis to get the desired count.
- Mark as New
- Bookmark
- Subscribe
- Mute
- Subscribe to RSS Feed
- Permalink
- Report Inappropriate Content
Hi ,
It can be acieved at front end using below expression :
=Count(Distinct{<[Customer Id] = {"=count(Distinct Date)=1"}>}[Customer Id])
Its like count of Distinct [Customer Id], against which there exists a single distinct Date
Regards,
Srashti
- Mark as New
- Bookmark
- Subscribe
- Mute
- Subscribe to RSS Feed
- Permalink
- Report Inappropriate Content
Hi Wrvs,
What is the expected output ? What do you mean by "first time ever" ?
KC
KC
- Mark as New
- Bookmark
- Subscribe
- Mute
- Subscribe to RSS Feed
- Permalink
- Report Inappropriate Content
I can't do it in script. Need to do it on front end because the definition of a new customer changes dynamically.
Eg:
If the user selects brand (not present in the dataset I provided), then he would see all customers that bought that brand for the first time.
If the user selects item, then he would see all customers that bought that Item for the first time.
Similarly, there are numerous dimensions and their combination:
Eg:
Brand B1 has three itsm I1,I2,I3
A customer bought I1 and I2 for the first time in Jan and bought I3 in Feb. Now if I select this brand through a list box, I will count the customer as new in Jan only. But if I select I3 then he would be new in Feb not Jan.
I hope you get the logic
- Mark as New
- Bookmark
- Subscribe
- Mute
- Subscribe to RSS Feed
- Permalink
- Report Inappropriate Content
A customers who shopped for the first time in Feb 2016 but also in Apr 2016. So he would be counted as new customer in Feb but not in Apr.
- Mark as New
- Bookmark
- Subscribe
- Mute
- Subscribe to RSS Feed
- Permalink
- Report Inappropriate Content
This did not work
- Mark as New
- Bookmark
- Subscribe
- Mute
- Subscribe to RSS Feed
- Permalink
- Report Inappropriate Content
Hello,
What you need, is Cohort analyse. See below some examples
https://community.qlikview.com/thread/212405
https://community.qlik.com/thread/212175
Regards,
Eliza
- Mark as New
- Bookmark
- Subscribe
- Mute
- Subscribe to RSS Feed
- Permalink
- Report Inappropriate Content
You can try this below expression,
=Count({<Month={'1'}>}[Customer Id])
Susovan
- Mark as New
- Bookmark
- Subscribe
- Mute
- Subscribe to RSS Feed
- Permalink
- Report Inappropriate Content
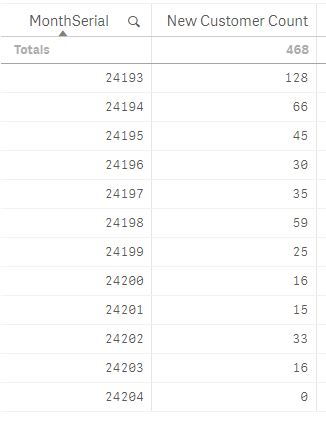
I made a monthserial in script like this
(Year*12)+Month as MonthSerial.
Now I made a table with dimension as Month Serial and Measure as below.
Count(
aggr(
min(MonthSerial),
[Customer Id]
)
)
I got this output.
When I did cohort in Scrip I got this output.
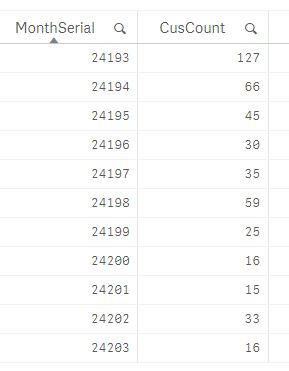
This is a difference of 1 customer in Month 24193 but rest of the data matches.
It will also work on selection.
Please let me know if output is correct.