Unlock a world of possibilities! Login now and discover the exclusive benefits awaiting you.
- Qlik Community
- :
- All Forums
- :
- QlikView App Dev
- :
- Controlling the width of bars in bar chart
- Subscribe to RSS Feed
- Mark Topic as New
- Mark Topic as Read
- Float this Topic for Current User
- Bookmark
- Subscribe
- Mute
- Printer Friendly Page
- Mark as New
- Bookmark
- Subscribe
- Mute
- Subscribe to RSS Feed
- Permalink
- Report Inappropriate Content
Controlling the width of bars in bar chart
Hi all,
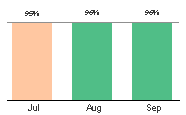
I am facing an issue with bar charts in my Qlikview project. The bar chart can display a total of 6 months data in my application. The issue is that when the chart displays 6 months, the size of the bars get smaller. I need the size of the bars to always be the same (whether two months are selected or 4 or 6).
For example, below you'll find the bar chart whereby 3 months are being displayed. They are all uniform in size.

However when 6 months are displayed, they get smaller.

By the way I have tried increasing the size of the bar chart for all bars to be uniform. However when less months are selected, the graph gets distorted.
Kindly help,
Mohesh
- Mark as New
- Bookmark
- Subscribe
- Mute
- Subscribe to RSS Feed
- Permalink
- Report Inappropriate Content
This isn't directly possible - the chart will always resize to the content. This meant you need a workaround which always showed the max. number of bars.
One workaround will be to use a second expressions like this:
= sum({1 < Month = {'*'}>} 1)
which will be hidden (per option not per expression-condition) and to hide the not possible month from the axis a calculated dimension with dual like:
=dual(if(aggr(count(distinct Month), Month) > 0, Month, ''), Month)
- Marcus
- Mark as New
- Bookmark
- Subscribe
- Mute
- Subscribe to RSS Feed
- Permalink
- Report Inappropriate Content
Thank you Marcus and sunny.that will help me.
- Mark as New
- Bookmark
- Subscribe
- Mute
- Subscribe to RSS Feed
- Permalink
- Report Inappropriate Content
Hi Marcus,
The Expression = sum({1 < Month = {'*'}>} 1) was worked for me.But Again i have a requirement like Though we have a year data currently using 6 months data in chart,if i use above Expression chart displaying the rest of the 6 months data too which is actually not. Can you help out with is this.
- Mark as New
- Bookmark
- Subscribe
- Mute
- Subscribe to RSS Feed
- Permalink
- Report Inappropriate Content
I think the conditions within the expression and dimension could be adjusted to match different requirements. But it could be easier to avoid this and using "normal" expression and dimension and adjust the number of bars with the options in tab presentation (top right).
- Marcus