Unlock a world of possibilities! Login now and discover the exclusive benefits awaiting you.
- Qlik Community
- :
- All Forums
- :
- QlikView App Dev
- :
- Re: Creating a Straight/Appropriate Table to view ...
- Subscribe to RSS Feed
- Mark Topic as New
- Mark Topic as Read
- Float this Topic for Current User
- Bookmark
- Subscribe
- Mute
- Printer Friendly Page
- Mark as New
- Bookmark
- Subscribe
- Mute
- Subscribe to RSS Feed
- Permalink
- Report Inappropriate Content
Creating a Straight/Appropriate Table to view Total "Amount"
Can somebody please assist me?
I created a straight table to show the total amount by Category of Excesses. The table doesn't display correctly. What am i doing wrong?
Display the Excesss Total Value per Unique Claim entry on the ClaimsListing table by adding the different type of Excesses together.
Ensure your date selection has an option to view data by Incident Period (MM/YYYY).
Please see: https://drive.google.com/open?id=1wk7AUNXITIsrzoY6uDgMxMFrvc-dO7n3 … AND https://drive.google.com/open?id=1Bdq0jxJ0g5cXg2jK_1YjUlr-josKXnkD …
- Mark as New
- Bookmark
- Subscribe
- Mute
- Subscribe to RSS Feed
- Permalink
- Report Inappropriate Content
Well on there two ways to close this:
* One ensure your model have that slicing relationship.
* Try using Aggregate function. It is one of the most powerful function of Qlik and fits in such requirements.
Please provide a sample app if need a deeper dig.
Thanks,
Sujeet
- Mark as New
- Bookmark
- Subscribe
- Mute
- Subscribe to RSS Feed
- Permalink
- Report Inappropriate Content
Here is a Straight table i created.
- Mark as New
- Bookmark
- Subscribe
- Mute
- Subscribe to RSS Feed
- Permalink
- Report Inappropriate Content
Here is the data model.
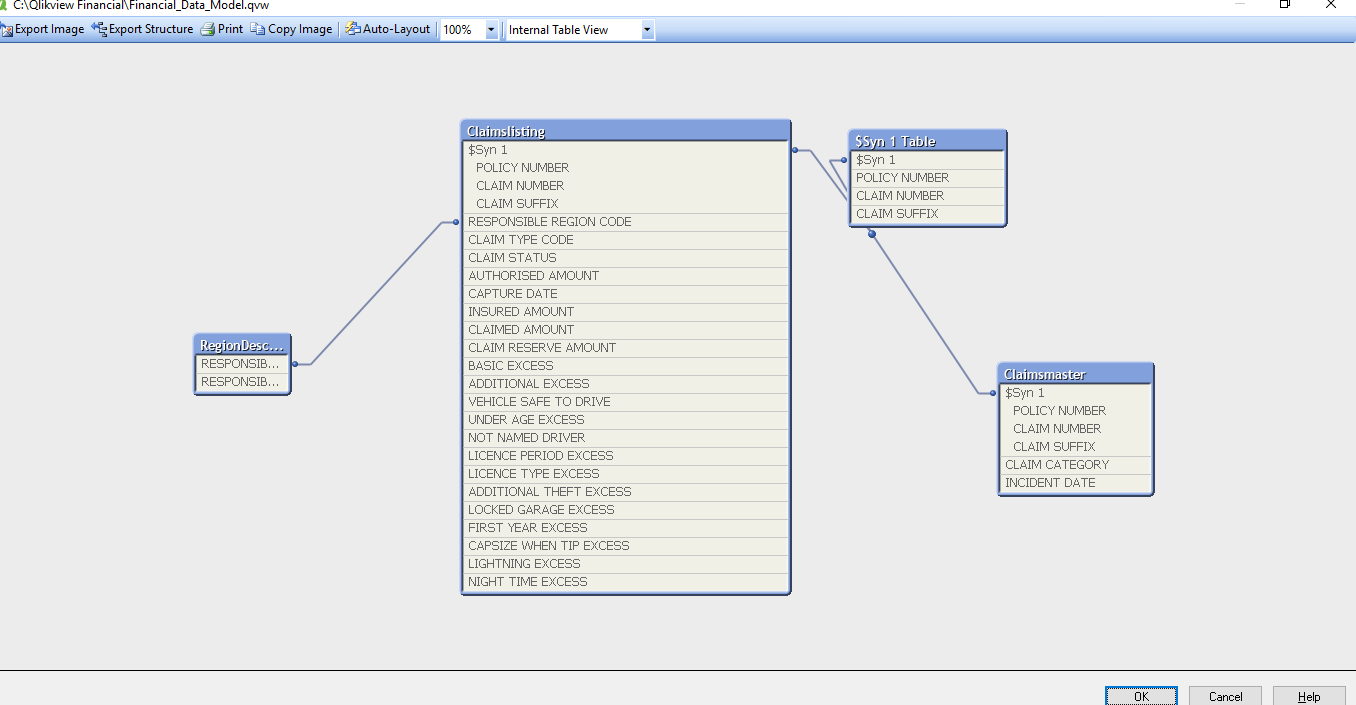
- Mark as New
- Bookmark
- Subscribe
- Mute
- Subscribe to RSS Feed
- Permalink
- Report Inappropriate Content
Did you tried the aggregate.
- Mark as New
- Bookmark
- Subscribe
- Mute
- Subscribe to RSS Feed
- Permalink
- Report Inappropriate Content