Unlock a world of possibilities! Login now and discover the exclusive benefits awaiting you.
- Qlik Community
- :
- All Forums
- :
- QlikView App Dev
- :
- Re: Display the variable value in lablel issue
- Subscribe to RSS Feed
- Mark Topic as New
- Mark Topic as Read
- Float this Topic for Current User
- Bookmark
- Subscribe
- Mute
- Printer Friendly Page
- Mark as New
- Bookmark
- Subscribe
- Mute
- Subscribe to RSS Feed
- Permalink
- Report Inappropriate Content
Display the variable value in lablel issue
HI
I have two variable vstart and vEnd . when i give date range in my chart like below..
Name, sal ,daterange
raju,5000,30
ramu,6000,20
i am expacted o/p ...
What ever given date range in filter level it showing chart like below..
Name, sal, 01-01-2018-01-06-2018(This date fields show by labes)
raju,5000,30
ramu,6000,20
i tried this expression(=Concat(Date($(vStartDate)-($(vEndDate)))))
how to do above thing?
Thanks,
Nani
Accepted Solutions
- Mark as New
- Bookmark
- Subscribe
- Mute
- Subscribe to RSS Feed
- Permalink
- Report Inappropriate Content
May be this?
let vStartDate = '2018-05-01';
let vEndDate ='2018-06-10';
T:load * inline [Name, sal ,daterange
raju,5000,30
ramu,6000,20]
Label : =(vStartDate) & '-' & (vEndDate)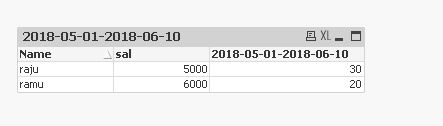
- Mark as New
- Bookmark
- Subscribe
- Mute
- Subscribe to RSS Feed
- Permalink
- Report Inappropriate Content
May be this?
let vStartDate = '2018-05-01';
let vEndDate ='2018-06-10';
T:load * inline [Name, sal ,daterange
raju,5000,30
ramu,6000,20]
Label : =(vStartDate) & '-' & (vEndDate)
- Mark as New
- Bookmark
- Subscribe
- Mute
- Subscribe to RSS Feed
- Permalink
- Report Inappropriate Content
You can increase your Height of Header from presentation tab? and for that, You can use this?
=Concat(Date($(vStartDate)-$(vEndDate)), '-')
- Mark as New
- Bookmark
- Subscribe
- Mute
- Subscribe to RSS Feed
- Permalink
- Report Inappropriate Content
Thank you:)
- Mark as New
- Bookmark
- Subscribe
- Mute
- Subscribe to RSS Feed
- Permalink
- Report Inappropriate Content
Glad to know it worked 