Unlock a world of possibilities! Login now and discover the exclusive benefits awaiting you.
- Qlik Community
- :
- All Forums
- :
- QlikView App Dev
- :
- Re: Graph design issue
- Subscribe to RSS Feed
- Mark Topic as New
- Mark Topic as Read
- Float this Topic for Current User
- Bookmark
- Subscribe
- Mute
- Printer Friendly Page
- Mark as New
- Bookmark
- Subscribe
- Mute
- Subscribe to RSS Feed
- Permalink
- Report Inappropriate Content
Graph design issue
Hello,
I am struggling on a chart and cannot understand where I am going wrong, if it is data setup or graph setup. I have a data set as defined below:
| Year | Qtr | Qtrlydate | Instances |
|---|---|---|---|
2015 | 2 | 2015 Qtr 2 | 0 |
| 2015 | 3 | 2015 Qtr 3 | 1 |
| 2015 | 4 | 2015 Qtr 4 | 3 |
| 2016 | 1 | 2016 Qtr 1 | 6 |
when I set a bar chart I want to have the sum of the Instances (ie 10) however when I set the properties and the expression for the data is Sum(Instances) for some reason I get 10 but I have 5 bars instead of 1. Any ideas as to why?
thank you.
Roberto
- Tags:
- new_to_qlikview
- Mark as New
- Bookmark
- Subscribe
- Mute
- Subscribe to RSS Feed
- Permalink
- Report Inappropriate Content
Hi Roberto,
it would be better if you could upload your qvw, so we can check the chart etc.
Andy
- Mark as New
- Bookmark
- Subscribe
- Mute
- Subscribe to RSS Feed
- Permalink
- Report Inappropriate Content
Hi,
As Andrew has suggested a sample would be good.
In the mean time,
what dimension(s) are you using?
Screen grab of the chart in question?
Mark
- Mark as New
- Bookmark
- Subscribe
- Mute
- Subscribe to RSS Feed
- Permalink
- Report Inappropriate Content
Please share screenshot of the bar chart to help us figure this better. First question here is to understand what dimension (X axis) do you have in that bar chart? Initial guess here is that perhaps the bar chart is ignoring dimension and is summing up all (hoping there is no set analysis expression to ignore dimension)
- Mark as New
- Bookmark
- Subscribe
- Mute
- Subscribe to RSS Feed
- Permalink
- Report Inappropriate Content
Hi ,
For quick solutions , share sample file.
Before check this ....
- Mark as New
- Bookmark
- Subscribe
- Mute
- Subscribe to RSS Feed
- Permalink
- Report Inappropriate Content
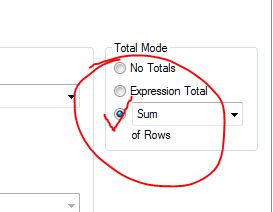
Thank you all for the comments and apologies for the late reply. Unfortunately got side tracked. I ended up finding my error and basically it was where I had the expression to sum the numbers. I have now fixed the issues.