Unlock a world of possibilities! Login now and discover the exclusive benefits awaiting you.
- Qlik Community
- :
- All Forums
- :
- QlikView App Dev
- :
- How to change the font color in PivotTable express...
- Subscribe to RSS Feed
- Mark Topic as New
- Mark Topic as Read
- Float this Topic for Current User
- Bookmark
- Subscribe
- Mute
- Printer Friendly Page
- Mark as New
- Bookmark
- Subscribe
- Mute
- Subscribe to RSS Feed
- Permalink
- Report Inappropriate Content
How to change the font color in PivotTable expressions (Como mudar a cor da fonte em Tabela Dinâmica expressões)
Hello,
I'm using a little time tool so I ask you to help me resolve this situation:
I am developing a review panel of media consumption of our equipment, making the filter data by year, month or week as the following expression:
if(vPeriodo=3,
a (avg ({<Year = {$ (vMaxAno)}>} MediaReal), '#. ## 0.00')
,
if(vPeriodo=2,
a (avg ({<Year = {$ (vMaxAno)}, month = {$ (vMaxMes)}>} MediaReal), '#. ## 0.00')
,
if(vPeriodo=1,
a (avg ({<Year = {$ (vMaxAno)}, Week = {$ (vMaxSemana)}>} MediaReal), '#. ## 0.00')
)
)
)
So I would like that the Average column values are highlighted red if the calculated average is outside the range of the lower and higher average for each row in the dynamic table, put the PivotTable is calculating the overall range of media as you can see below:

what kind of expression I use for the table calculate only the average of the line?
I thank you for your help.
Translated with Google Translate - Qlik Community Administrative Team
Olá,
Estou utilizando a ferramenta a pouco tempo por isso peço que me ajudem a resolver a seguinte situação:
Estou desenvolvendo um painel de analise das medias de consumo de nossos equipamentos, fazendo o filtro dos dados por ano, mês ou semana conforme a expressão abaixo:
if(vPeriodo=3,
num(avg({<Ano={$(vMaxAno)}>}MediaReal),'#.##0,00')
,
if(vPeriodo=2,
num(avg({<Ano={$(vMaxAno)},Mês={$(vMaxMes)}>}MediaReal),'#.##0,00')
,
if(vPeriodo=1,
num(avg({<Ano={$(vMaxAno)},Semana={$(vMaxSemana)}>}MediaReal),'#.##0,00')
)
)
)
Então eu gostaria que os valores da coluna Média sejam destacados de vermelho se a média calculada esteja fora do intervalo da menor e maior média de cada linha da tabela dinâmica, porem a tabela dinâmica está calculando o intervalo geral de media como podem ver abaixo:
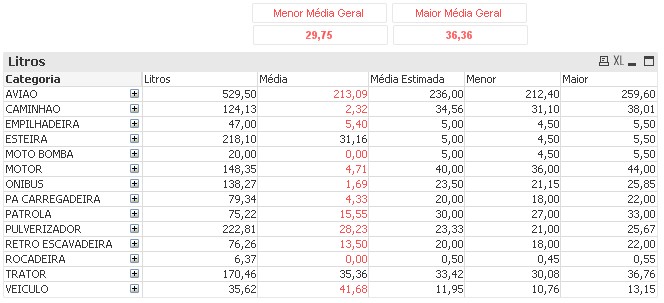
que tipo de expressão posso utilizar para a tabela calcular apenas a média da linha?
Desde já agradeço pela ajuda.
- Tags:
- new_to_qlikview