Unlock a world of possibilities! Login now and discover the exclusive benefits awaiting you.
- Qlik Community
- :
- All Forums
- :
- QlikView App Dev
- :
- How to drill down from a big group of pie chart in...
- Subscribe to RSS Feed
- Mark Topic as New
- Mark Topic as Read
- Float this Topic for Current User
- Bookmark
- Subscribe
- Mute
- Printer Friendly Page
- Mark as New
- Bookmark
- Subscribe
- Mute
- Subscribe to RSS Feed
- Permalink
- Report Inappropriate Content
How to drill down from a big group of pie chart into more specific group of pie chart.
Hi Qlikview Experts,
This might be easy for you all but I have faced difficulties in creating a pie chart with drill down group. I have 2 fields which are "MachineNumber" & "Result" respectively. In "MachineNumber" field contains '149','109', '164' etc. In "Result" field contains 'battery_low', 'battery_full', 'machine_down', 'machine_good', 'machine_bad', 'machine_perfect' etc.
I have created a pie chart and let "MachineNumber" to be the dimension. Then I want to count how many times does 'machine_down' 'machine_good' and 'machine_bad' have appeared in % form, so I have created an expression syntax as follow:
=(count({<[Result] = {'machine_down','machine_good','machine_bad'}>}[Result])) / (count(Result) *100
At this juncture, I am still able to get the half of the goal that I desired. The legend of this pie chart displayed the MachineNumber.
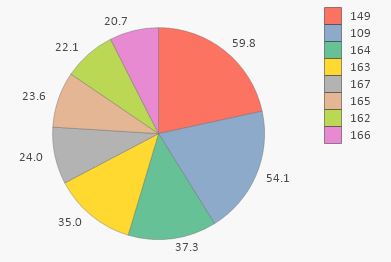
Then the problems come. Now I would like to create a drill down group and see the more specific % of a particular outcome inside one of the slices of this pie chart. Let say I would like to see MachineNumber 149 which is 59.8% (Containing the % of 'machine_down' 'machine_good' and 'machine_bad'), If user click on this slice, it should be able to drill down and display the % in a more specific pie chart for:
% of 'machine_down' (Maybe like 20%)
% of 'machine_good' (Maybe like 10%)
% of 'machine_bad'. (Maybe like 29.8%)
But I have difficulties in doing this 2nd part of my goal. I hope Qlikview Experts like you can help me solve this problem. Appreciate a lot for your help!
Accepted Solutions
- Mark as New
- Bookmark
- Subscribe
- Mute
- Subscribe to RSS Feed
- Permalink
- Report Inappropriate Content
What are your dimensions? Add Result field in your dimension and see? Can you share your app if possible to work on?
- Mark as New
- Bookmark
- Subscribe
- Mute
- Subscribe to RSS Feed
- Permalink
- Report Inappropriate Content
try this one
=AGGR(NO DISTINCT (count({<[Result] = {'machine_down','machine_good','machine_bad'}>}[Result])),measures) / (count(Result) *100
- Mark as New
- Bookmark
- Subscribe
- Mute
- Subscribe to RSS Feed
- Permalink
- Report Inappropriate Content
Hi Shiva,
Thanks for your suggestion. I did tried to change my expression according to the one you mentioned above. However, it looks like there are errors in this expression and pie chart was unable to display any data by using this one.
Regards,
QianNing
- Mark as New
- Bookmark
- Subscribe
- Mute
- Subscribe to RSS Feed
- Permalink
- Report Inappropriate Content
remove the no distinct and try,one more thing that aggr field is measures which i may have written wrong .
- Mark as New
- Bookmark
- Subscribe
- Mute
- Subscribe to RSS Feed
- Permalink
- Report Inappropriate Content
Hi Shiva,
The expression somehow just not working and I have no idea where went wrong...The following picture attached is the situation I was facing now.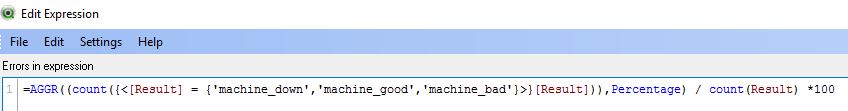

Best Regards,
QianNing
- Mark as New
- Bookmark
- Subscribe
- Mute
- Subscribe to RSS Feed
- Permalink
- Report Inappropriate Content
here i see the problem ,instead of percentage after result in the numerator use MachineNumber
- Mark as New
- Bookmark
- Subscribe
- Mute
- Subscribe to RSS Feed
- Permalink
- Report Inappropriate Content
Hi Shiva,
I have changed the expression syntax and there is no more errors.  However, when I clicked on my pie chart and try to drill in to see the more specific % for 3 different outcomes, the pie chart is not working properly. The following pictures attached is the new situation I was facing now.
Before Click on machine 109:

After Click on machine 109:

The amount of percentage still remains the same. This is not the correct display, it suppose to show the individual % for machine_down, machine_good, and machine_bad. Hope to hear from you soon!
Best Regards,
QianNing
- Mark as New
- Bookmark
- Subscribe
- Mute
- Subscribe to RSS Feed
- Permalink
- Report Inappropriate Content
What are your dimensions? Add Result field in your dimension and see? Can you share your app if possible to work on?
- Mark as New
- Bookmark
- Subscribe
- Mute
- Subscribe to RSS Feed
- Permalink
- Report Inappropriate Content
Hi Vishwarath,
The following pictures attached is the drill down group I have used in my dimension.


Best Regards,
QianNing
- Mark as New
- Bookmark
- Subscribe
- Mute
- Subscribe to RSS Feed
- Permalink
- Report Inappropriate Content
Hi
How did resolve as i am facing the same issue in pie chart drill down?
Thanks
Kritika