Unlock a world of possibilities! Login now and discover the exclusive benefits awaiting you.
- Qlik Community
- :
- All Forums
- :
- QlikView App Dev
- :
- How to show this in chart
- Subscribe to RSS Feed
- Mark Topic as New
- Mark Topic as Read
- Float this Topic for Current User
- Bookmark
- Subscribe
- Mute
- Printer Friendly Page
- Mark as New
- Bookmark
- Subscribe
- Mute
- Subscribe to RSS Feed
- Permalink
- Report Inappropriate Content
How to show this in chart
Hi All,
I am having following requirement. In my 3 tables 9Customers,Service & Versions) I need to show this Customer performing this Service using this Version.
As I need to show data as it is , the aggr functions may not required
- Tags:
- new_to_qlikview
- « Previous Replies
-
- 1
- 2
- Next Replies »
- Mark as New
- Bookmark
- Subscribe
- Mute
- Subscribe to RSS Feed
- Permalink
- Report Inappropriate Content
Hi,
is there any association between tables you mentioned?
BR
M
- Mark as New
- Bookmark
- Subscribe
- Mute
- Subscribe to RSS Feed
- Permalink
- Report Inappropriate Content
My Data will Look like Below
Customers:
CUST Service
A1 S1
A2 S2
A3 S1
Service:
Service Version
S1 1.0
S2 1.0
Version:
Ver Desc
1.0 ALL
2.0 PVT
3.0 IT
- Mark as New
- Bookmark
- Subscribe
- Mute
- Subscribe to RSS Feed
- Permalink
- Report Inappropriate Content
Hi
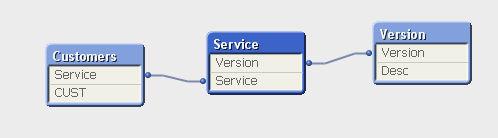
Rename Ver column to Version in Version table. So that it will create a Join with Version column in service table.
Find below the sample script and table join diagram. Once the join created you can filter the data accordingly.
Customers:
LOAD * INLINE
[CUST,Service
A1,S1
A2,S2
A3,S1];
Service:
LOAD * INLINE
[Service,Version
S1,1.0
S2,1.0];
Version:
LOAD * INLINE
[Version,Desc
1.0,ALL
2.0,PVT
3.0,IT];
I hope this helps
- Mark as New
- Bookmark
- Subscribe
- Mute
- Subscribe to RSS Feed
- Permalink
- Report Inappropriate Content
Just rename your Ver field by Version and create table with your desirable fields.
- Mark as New
- Bookmark
- Subscribe
- Mute
- Subscribe to RSS Feed
- Permalink
- Report Inappropriate Content
Hi Martin & Sampath,
Thanks for your help. I am looking for, how to show the values in desired manner. I already completed my data modeling. Now I need to show above requirement in a graph. That is what I asking.
-Jay
- Mark as New
- Bookmark
- Subscribe
- Mute
- Subscribe to RSS Feed
- Permalink
- Report Inappropriate Content
Create bar chart with customer, service dimensions and count Version. Is that what are you looking for?
- Mark as New
- Bookmark
- Subscribe
- Mute
- Subscribe to RSS Feed
- Permalink
- Report Inappropriate Content
Hi Martin,
you are right, But thing is I don't want to Count anything. Because counting the version is not meaning full here.
- Mark as New
- Bookmark
- Subscribe
- Mute
- Subscribe to RSS Feed
- Permalink
- Report Inappropriate Content
Attach your data sample, please. Would be better.
- Mark as New
- Bookmark
- Subscribe
- Mute
- Subscribe to RSS Feed
- Permalink
- Report Inappropriate Content
Hi Martin,
I cant attach data due to restrictions. All I need is your idea/Suggestions. So kindly let me know
- « Previous Replies
-
- 1
- 2
- Next Replies »