Unlock a world of possibilities! Login now and discover the exclusive benefits awaiting you.
- Qlik Community
- :
- All Forums
- :
- QlikView App Dev
- :
- In Script - group percentage values
- Subscribe to RSS Feed
- Mark Topic as New
- Mark Topic as Read
- Float this Topic for Current User
- Bookmark
- Subscribe
- Mute
- Printer Friendly Page
- Mark as New
- Bookmark
- Subscribe
- Mute
- Subscribe to RSS Feed
- Permalink
- Report Inappropriate Content
In Script - group percentage values
Hi,
My data contain five different records to express a percentage value. for instance:
MyTable
Load Id,
red.perc,
yellow.perc,
blu.perc,
...
FROM ....
red.perc, yellow.perc and blu.perc are float numbers such that red.perc+yellow.perc+blu.perc=1
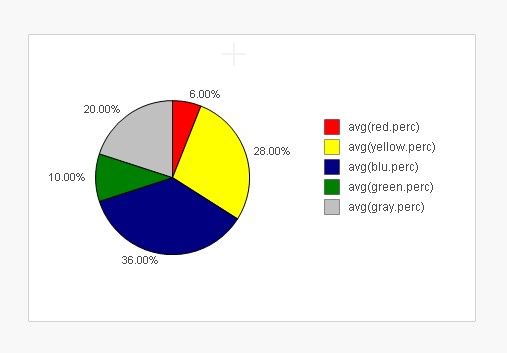
I would then like to create a pie chart that has as dimension the colors and has expression the average of each one.
Which solution would you suggest?
Accepted Solutions
- Mark as New
- Bookmark
- Subscribe
- Mute
- Subscribe to RSS Feed
- Permalink
- Report Inappropriate Content
Hi Giusy,
you can load your values like this:
Table
Load Id,
'RED' AS COLOR_NAME
red.perc AS PERC
...
FROM ....
JOIN
Load Id,
'BLUE' AS COLOR_NAME
blue.perc AS PERC
...
FROM ....
then you can use the pie chart, with "COLOR_NAME" as dimension, and AVG(PERC) as expression.
- Mark as New
- Bookmark
- Subscribe
- Mute
- Subscribe to RSS Feed
- Permalink
- Report Inappropriate Content
a dimensionless pie chart with five avg(...) expressions