Unlock a world of possibilities! Login now and discover the exclusive benefits awaiting you.
- Qlik Community
- :
- All Forums
- :
- QlikView App Dev
- :
- Re: Y-axis (expression) formatting
- Subscribe to RSS Feed
- Mark Topic as New
- Mark Topic as Read
- Float this Topic for Current User
- Bookmark
- Subscribe
- Mute
- Printer Friendly Page
- Mark as New
- Bookmark
- Subscribe
- Mute
- Subscribe to RSS Feed
- Permalink
- Report Inappropriate Content
Y-axis (expression) formatting
Hi,
I have a line chart that looks like this:
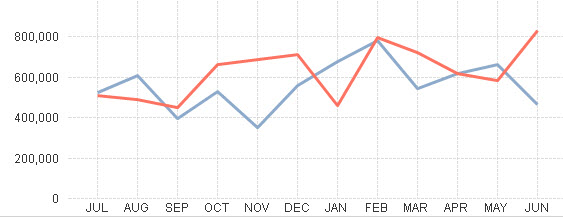
How do you format the Y-axis to be of money type? Example, I want to show $800,000, $600,00 and etc.
I've looked through all the tabs for the line chart and especially the Axis tab -> Expression Axes. I don't see anything
relevant on changing y-axis to money.
Can someone help?
Thank you
- « Previous Replies
-
- 1
- 2
- Next Replies »
- Mark as New
- Bookmark
- Subscribe
- Mute
- Subscribe to RSS Feed
- Permalink
- Report Inappropriate Content
There are 2 ways to do it:
1)Change the settings in the Number tab of the chart properties to Money and add $ in the Symbol box.
This adds $ sign on top of the y-axis and in the values on the data points.
2)Add value in the "Static Step" option under the Axes tab, this will internally take the option set in the Number tab ,if you select "Money" then this will show it in that format. Try putting values like 1000 under the static step ,i haven't tried it for your data set but it should work
- Mark as New
- Bookmark
- Subscribe
- Mute
- Subscribe to RSS Feed
- Permalink
- Report Inappropriate Content
Vivek,
Good suggestion. But it only works for certain data scenarios (at least for the data I've). When I pick different years,
the $ may or may not display because the data points are different. The "static step", as the name implies, I am guess
it only works under certain range of values
- Mark as New
- Bookmark
- Subscribe
- Mute
- Subscribe to RSS Feed
- Permalink
- Report Inappropriate Content
you can write a dynamic formula too ,it need not be static
- Mark as New
- Bookmark
- Subscribe
- Mute
- Subscribe to RSS Feed
- Permalink
- Report Inappropriate Content
It worked fine for me when I used /1000000 , '$#,##0 M' for Million.
But changing the Y axis all values to $ is not possible. Only possible way to show is as data points.
- Mark as New
- Bookmark
- Subscribe
- Mute
- Subscribe to RSS Feed
- Permalink
- Report Inappropriate Content
Luu,
I recommend you to go thorough the below link where kent has written a dynamic code snippet for the same.
In bar chart $ symbol can't be prefixed to the numbers in y-axis?
- Mark as New
- Bookmark
- Subscribe
- Mute
- Subscribe to RSS Feed
- Permalink
- Report Inappropriate Content
OK, thanks. I will look and post an update later.
- Mark as New
- Bookmark
- Subscribe
- Mute
- Subscribe to RSS Feed
- Permalink
- Report Inappropriate Content
Also,take a look at the below link too
Currency and Other Symbols on the Y-Axis | Qlikview Cookbook
- « Previous Replies
-
- 1
- 2
- Next Replies »