Unlock a world of possibilities! Login now and discover the exclusive benefits awaiting you.
- Qlik Community
- :
- Blogs
- :
- Technical
- :
- Design
- :
- Bill of Materials
- Subscribe to RSS Feed
- Mark as New
- Mark as Read
- Bookmark
- Subscribe
- Printer Friendly Page
- Report Inappropriate Content
Most hierarchies are dimensional hierarchies. This implies several things: First, you have a many-to-one relationship between the levels: a day belongs to one (and only one) month, a month to one (and only one) quarter, etc. Strictly speaking, it is not a hierarchy unless this condition is fulfilled.
Secondly, the hierarchy contains no measures. Instead, numbers are stored in a transactional table that is linked to the dimensional hierarchy.
But there is another hierarchy-like structure, the Bill of Materials, the “BoM”. This is a list of items, assemblies and sub-assemblies representing the design of a product or device. Many products are planned and documented with BoMs.
A multi-level BoM depicts parent-child relationships and shows the hierarchical structure of the assemblies and their related subcomponents. A multi-level BoM is essentially a nested list whose items are listed to illustrate multiple assemblies within a product.
But a BoM is very different from a dimensional hierarchy. It does not have to have a strict many-to-one relationship between the levels. For instance, a specific bearing type can be used in several places. For the BoM, this means that the bearing can have several parents in the hierarchy.
Further, each line in the BoM has numbers in it, typically Quantity and Cost. These are measures that should be summed. In a sense, a BoM is more similar to a transaction table than a dimensional table.
A BoM can easily be loaded and analyzed with Qlik Sense or QlikView, but there are some challenges: First, the list often lacks a parent reference. Instead, the parent-child relationship is implied by the order of the rows and the Level field, and visualized by indentations.
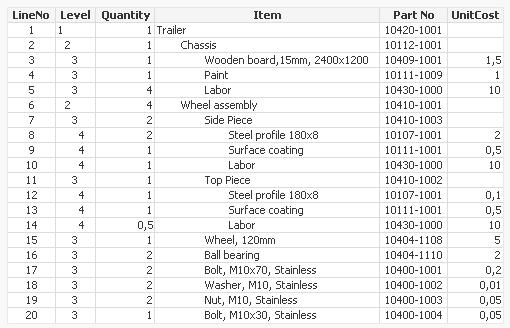
Secondly, aggregating the measures is not straightforward. When summing the costs, the multiplicities of all the nodes above it must be taken into account. In the example in the above table, the wheel assembly uses 2 bearings, and the trailer uses 4 wheel assemblies. Then the trailer obviously needs 8 bearings. In other words: The row for the wheel assembly – and all rows belonging to it – must be looped 4 times when summing the cost.
Luckily, both these challenges can be handled in the Qlik script. One possible solution is the following:
Hierarchy ( [Part No], Parent, Description )
Load *,
Subfield( Path, '/', Level ) as Parent;
Load *,
Left( Peek( Path ), Index( Peek( Path ) & '/', '/', Level ) -1 ) & '/' & [Part No] as Path
While IterNo() <= Units;
Load *,
If( Frac( Quantity)=0, Quantity, 1 ) as Units,
If( Frac( Quantity)=0, 1, Quantity ) as Amount
From BoM ;
The reference to the parent is created in two steps: First a Path is built using the Level and the Path of the above row. Having the path, it is straightforward to extract the parent id using Subfield().
Further, each row is loaded several times using a while loop. Hence, row 16 (the ball bearings) is loaded twice since its Quantity is 2. But it should be loaded 8 times since the Quantity of its parent (row 6, Wheel assembly) is 4. This multiplication is achieved using the Hierarchy prefix.
Finally, the above multiplication algorithm only works for integer quantities. For this reason the bottom Load splits the Quantity into two fields: a field Units that is used in the While loop, and an Amount that is used in the aggregation:
Sum( Amount * UnitCost )
However, this means that nodes that have non-integer quantities cannot have any children. If they do, the above algorithm cannot be used, and the cost roll-up must be made a different way. Luckily, this is rarely – or never – the case in real life.
Good luck with your Bill of Materials!
Further reading related to this topic:
- « Previous
-
- 1
- 2
- 3
- Next »
You must be a registered user to add a comment. If you've already registered, sign in. Otherwise, register and sign in.