Unlock a world of possibilities! Login now and discover the exclusive benefits awaiting you.
- Qlik Community
- :
- Blogs
- :
- Technical
- :
- Design
- :
- Get Familiar with Qlik GeoAnalytics - Custom Info ...
- Subscribe to RSS Feed
- Mark as New
- Mark as Read
- Bookmark
- Subscribe
- Printer Friendly Page
- Report Inappropriate Content
My friend and colleague bps (Patric Nordstron), Sr. Product Manage for Qlik GeoAnalytics, recently made me aware of some pretty cool tips and tricks he developed that allow you to customize your info bubbles when using Qlik GeoAnalytics map objects. It is written in a post here: Adding a Sense chart into a Qlik GeoAnalytics map info bubble. I though this was a really clever way of not only providing additional information on top of your Qlik GeoAnalytics maps, but also a great way to showcase the power of our Qlik Sense APIs. I decide to create a quick video on the topic as part of my series on making you more familiar with Qlik GeoAnalytics. Let us know what you think! Enjoy.
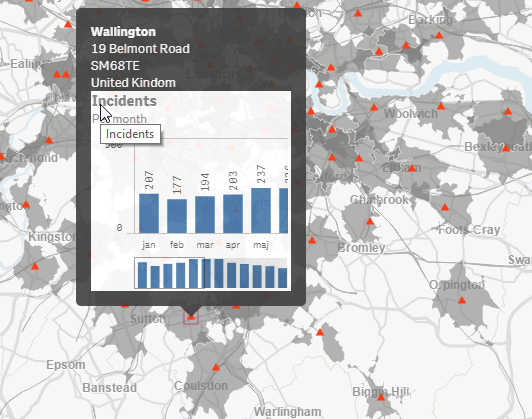
Qlik GeoAnalytics - Custom Info Bubble
Regards,
Qlik
Can't see the video? YouTube blocked by your region or organization? Download the .mp4 video to watch on your computer or mobile device.
Resources:
Part 1: Qlik Geocoding - Street Addresses and Qlik GeoAnalytics
Part 2: Get Familiar with Qlik GeoAnalytics - The "Closest" Operator
You must be a registered user to add a comment. If you've already registered, sign in. Otherwise, register and sign in.