Unlock a world of possibilities! Login now and discover the exclusive benefits awaiting you.
- Qlik Community
- :
- Blogs
- :
- Technical
- :
- Design
- :
- Visualizing comorbidity. Set analysis element func...
- Subscribe to RSS Feed
- Mark as New
- Mark as Read
- Bookmark
- Subscribe
- Printer Friendly Page
- Report Inappropriate Content
A few months ago we at the demo team accepted the challenge to create a prototype for the healthcare industry. The goal was to create a user-friendly way to analyze a huge dataset provided by one of our healthcare partners, DarkMatter2bd. They carefully explained to us some usage cases for their data and we agreed to create a mashup to analyze and visualize “comorbidity”.
So what does comorbidity means?
In medicine, comorbidity is the presence of one or more additional diseases or disorders co-occurring with (that is, concomitant or concurrent with) a primary disease or disorder; in the countable sense of the term, a comorbidity (plural comorbidities) is each additional disorder or disease.
Source: Wikipedia
If you are in the healthcare industry then I am sure you have heard someone asking something like: can you show me patients that have X and Y and Z? To answer that question and some more we came up with a new mash up called Pre-launch Targeting & Clinical Trial Recruitment. It contains non-real data for almost six hundred thousand patients located in the state of Pennsylvania.
When a user gets into the mashup we prompt them with a search box that performs a search across the entire range of diseases or disorders available in our data sample. Once the user has chosen a primary disease we take them to the Recruitment page where data can be freely explored and analyzed, and more importantly, where more disorders or diseases can be added to the query.
Real use case scenario.
An imaginary healthcare company is planning to launch a new drug for people suffering from diabetes and they need to find a group of patients that meet some requirements. They must have diabetes and must have hypertension but must not be allergic to penicillin.
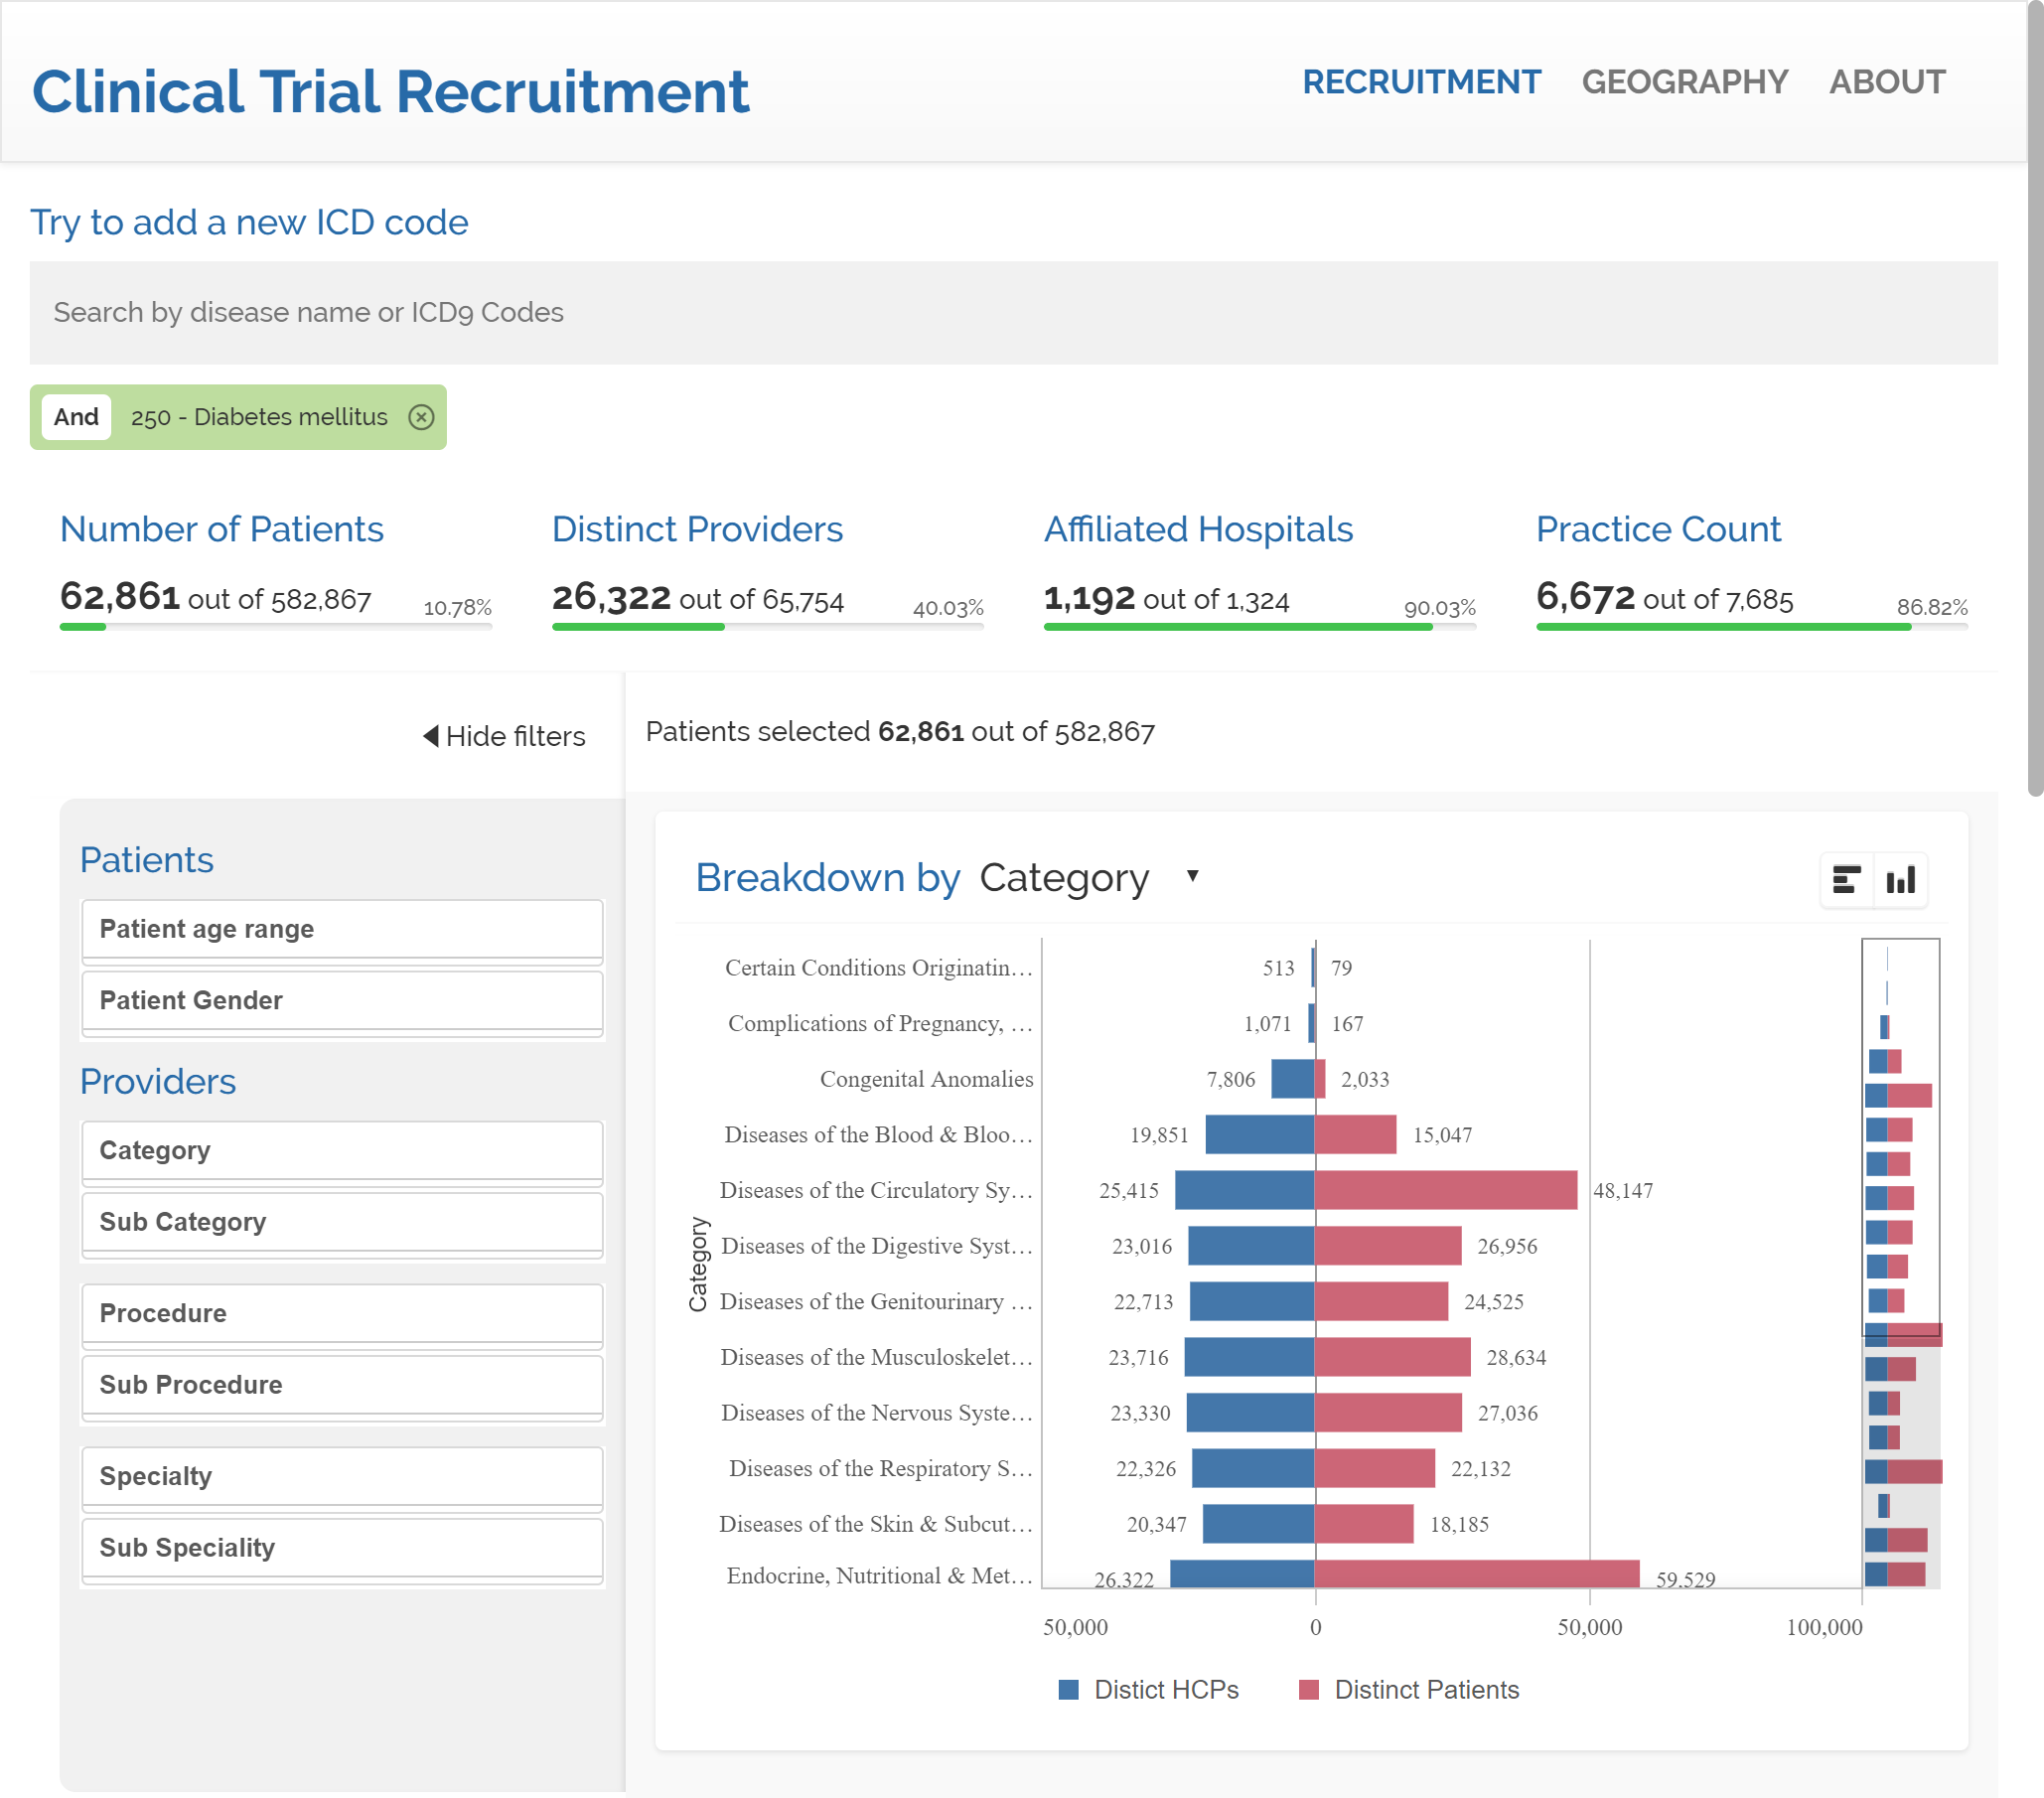
After we search for diabetes we get to a count of 62,861 patients in our data. It represents approximately a 10% of our sample. Next is time to search for hypertension. We will add a second condition to our query.
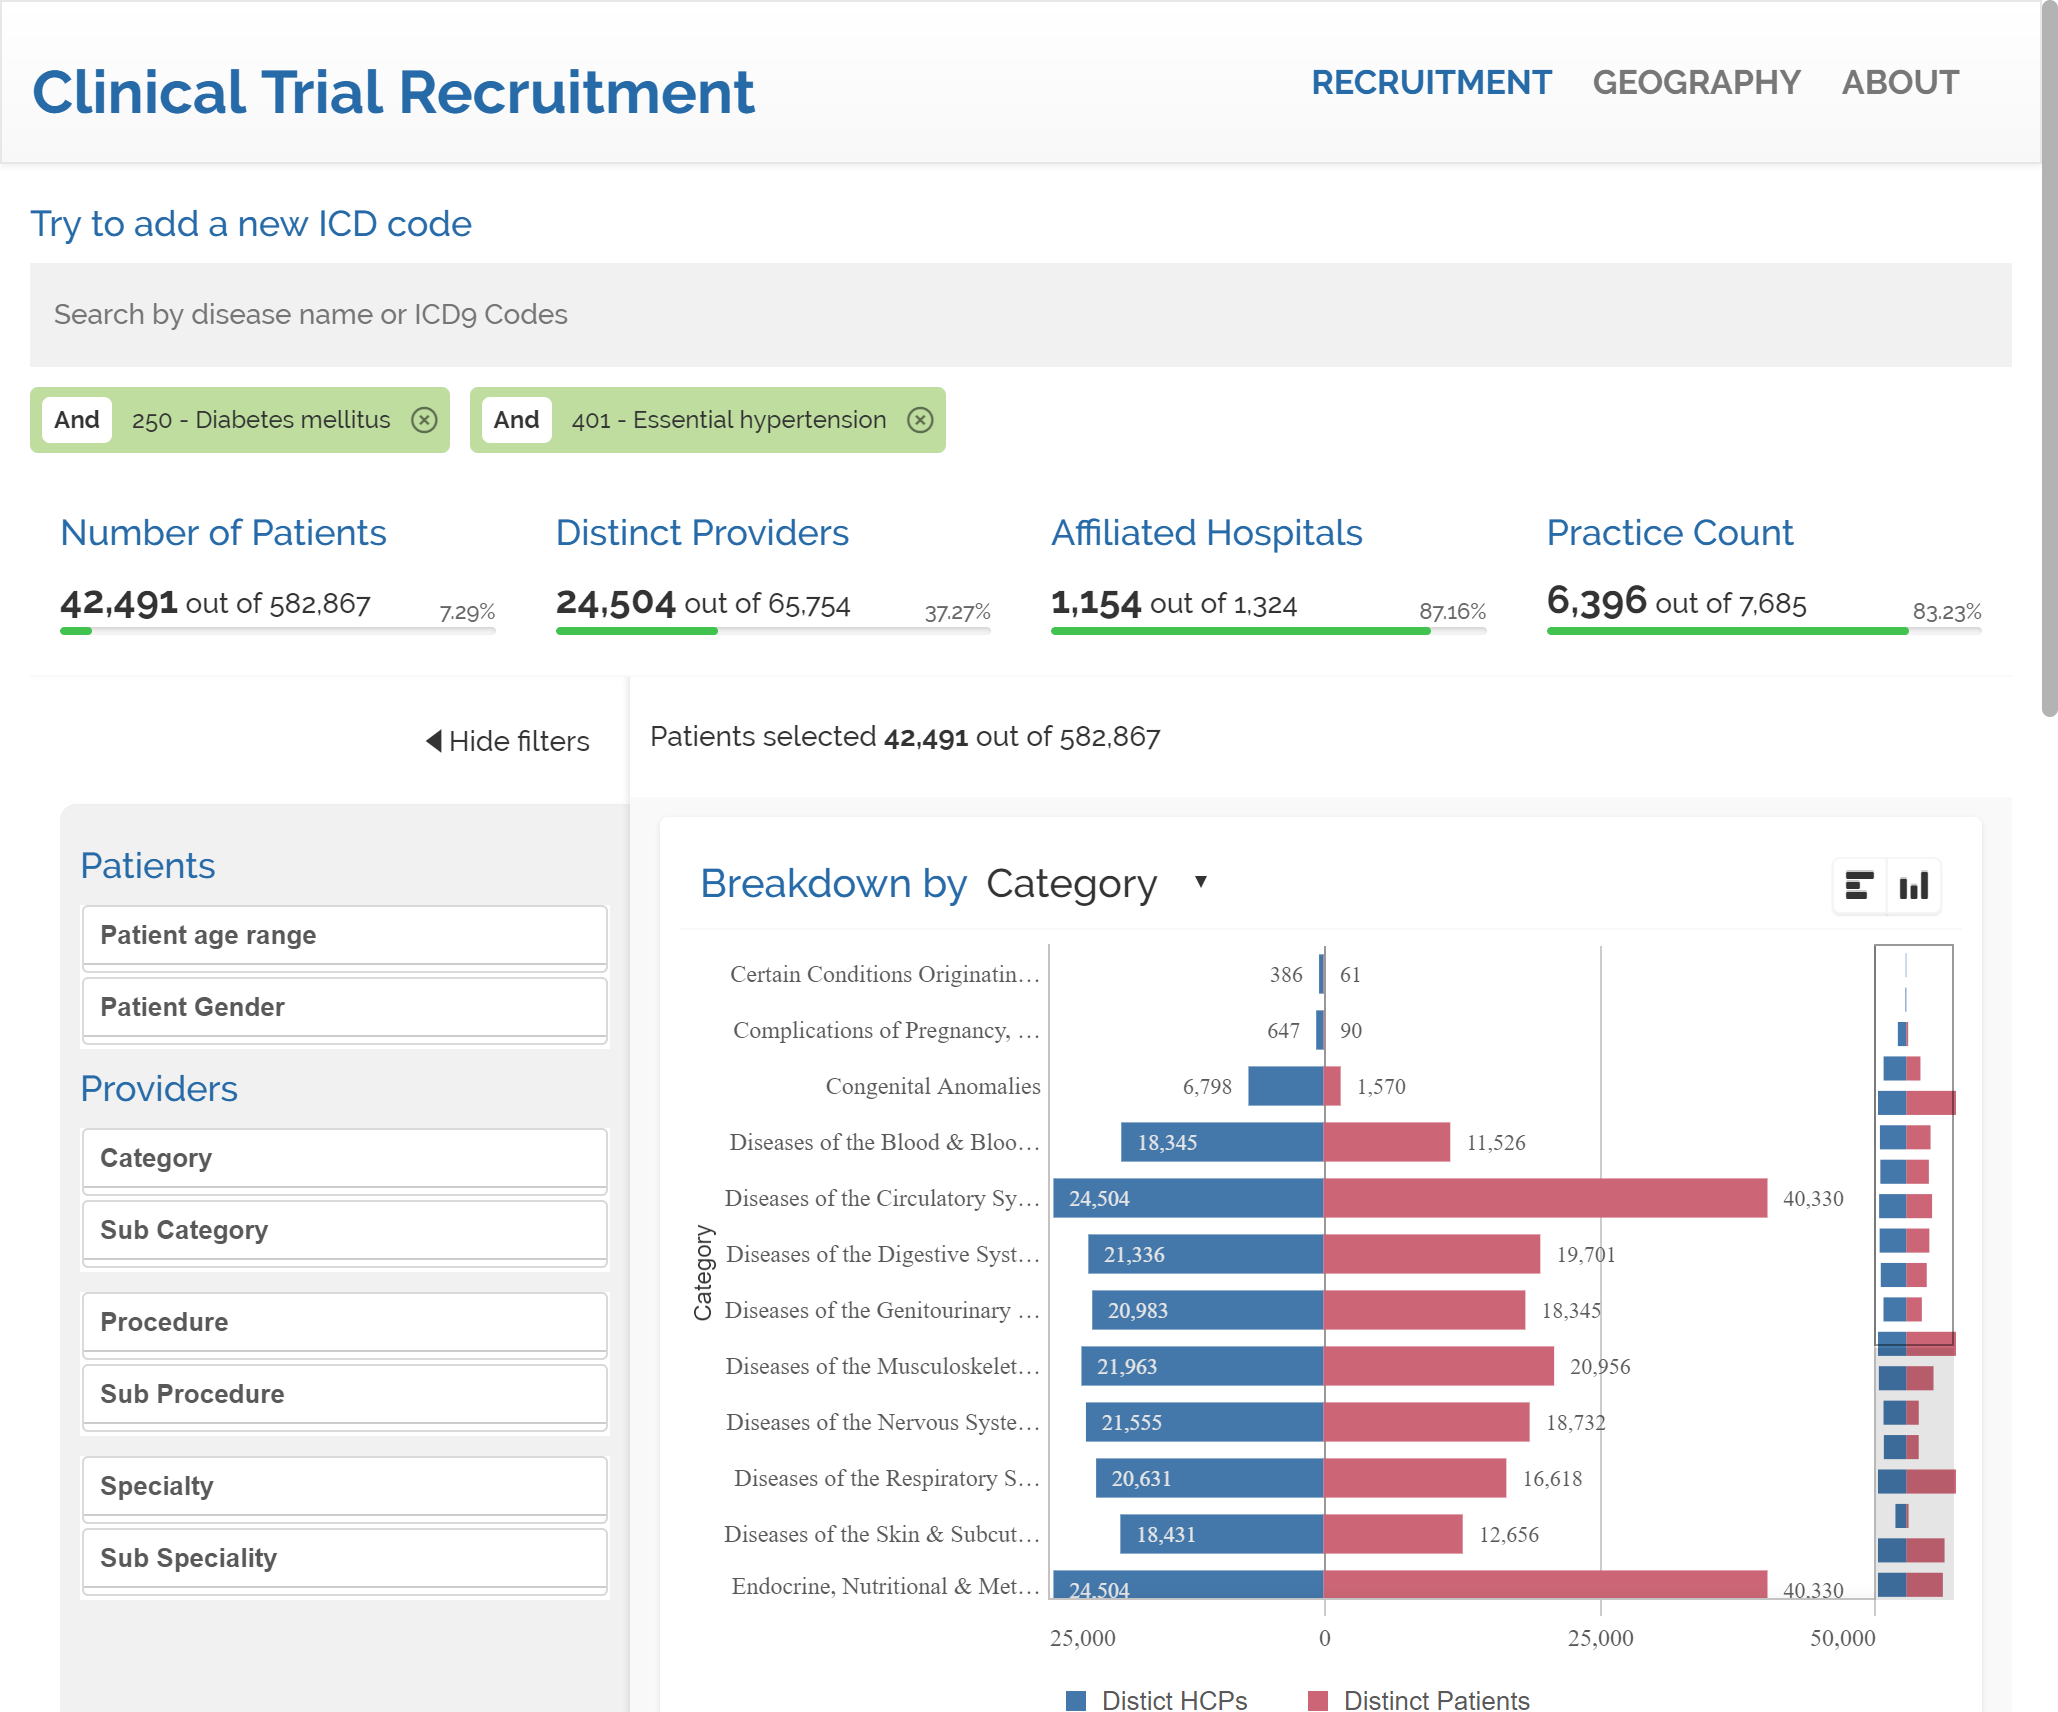
The inclusion of hypertension draws 42,491 patients that suffer from both diabetes & hypertension.
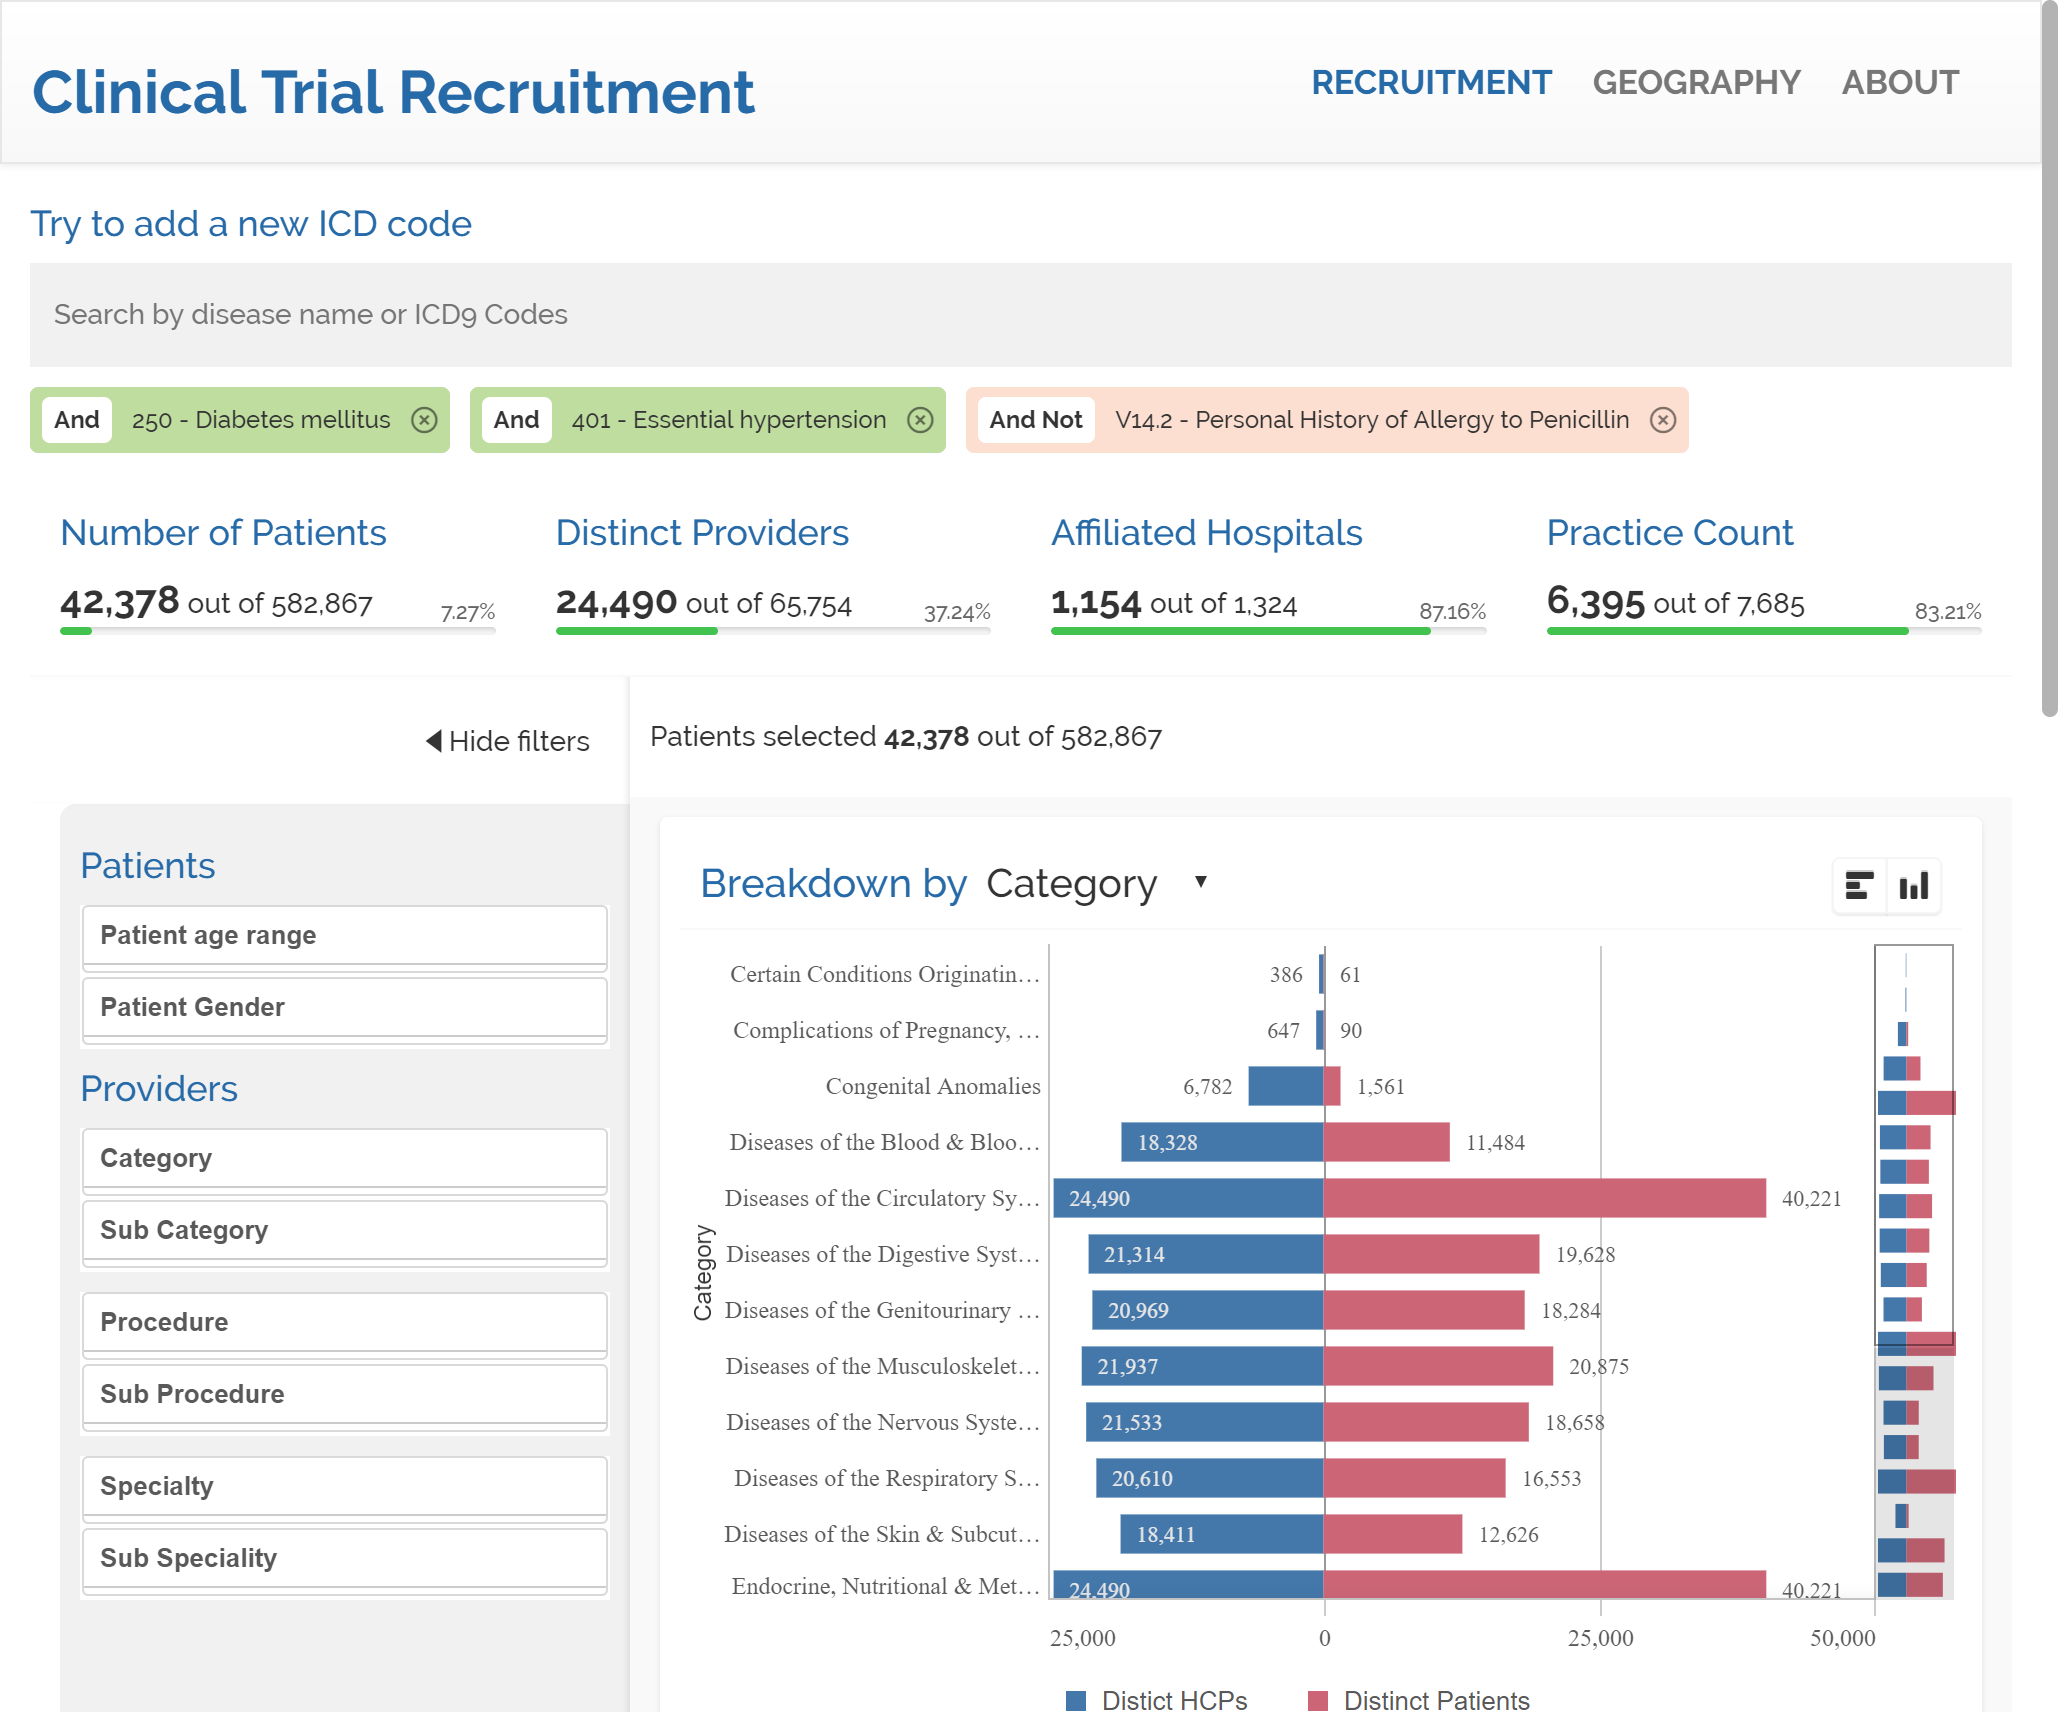
Our last search will be penicillin intolerance. Please notice that by default our mashup will add new search terms with AND condition to the query. The count of patients temporarily reflects 113 patients for the combination of diabetes AND hypertension AND penicillin allergy. Users can freely switch any condition to AND NOT by clicking into the tag. By doing so in the "Personal History of Allergy to Penicillin" tag we end up having a result set that matches our initial request, resulting in 42,378 patients with diabetes AND hypertension AND NOT penicillin allergy.
Set analysis element function P()
The secret sauce in our recipe is the Set analysis element function P(), it helps us to create subsets of data which we can operate with.
We basically want to count patients where disease = X and disease = Y. If we use Qlik notation for that condition would look like:
Count({<patient = P({<disease={'X'}>}patient) * P({<disease={'Y'}>}patient)>} distinct Patient)
The expression above will create two sets, P({<disease={'X'}>}patient) will contain all the possible patients that have disease = X, while the second piece P({<disease={'Y'}>}patient), will retrieve all the possible patients with disease = Y. Finally the " * " operator will calculate the intersection of both sets.
The webapp Pre-launch Targeting & Clinical Trial Recruitment dynamically creates as many P sets as needed and the right operator to compose the right expression.
If you want to learn more about Set Analysis please check this posts:
Why is it called Set Analysis?
I hope you like Pre-launch Targeting & Clinical Trial Recruitment
Arturo (@arturoqv)
- « Previous
-
- 1
- 2
- Next »
You must be a registered user to add a comment. If you've already registered, sign in. Otherwise, register and sign in.