Unlock a world of possibilities! Login now and discover the exclusive benefits awaiting you.
- Qlik Community
- :
- All Forums
- :
- GeoAnalytics
- :
- How can I deal with big data like 200000 [long,lat...
- Subscribe to RSS Feed
- Mark Topic as New
- Mark Topic as Read
- Float this Topic for Current User
- Bookmark
- Subscribe
- Mute
- Printer Friendly Page
- Mark as New
- Bookmark
- Subscribe
- Mute
- Subscribe to RSS Feed
- Permalink
- Report Inappropriate Content
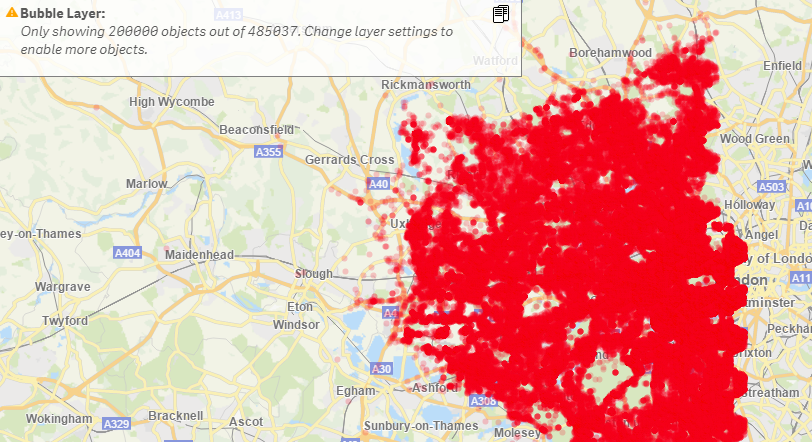
How can I deal with big data like 200000 [long,lat] ?
Hi all,
I've case here to deal with 200000 [long, lat] I try to displaying them but the App get hang , what is the best practice ?
also how can i aggregate them all point take one of three status {new,old,renew}
- Mark as New
- Bookmark
- Subscribe
- Mute
- Subscribe to RSS Feed
- Permalink
- Report Inappropriate Content
hi
your best solution will be to use cluster function
look at this tutorial
- Mark as New
- Bookmark
- Subscribe
- Mute
- Subscribe to RSS Feed
- Permalink
- Report Inappropriate Content
Hi ,
Thanks for your response ,
I'll try this solution and let you now if it work
- Mark as New
- Bookmark
- Subscribe
- Mute
- Subscribe to RSS Feed
- Permalink
- Report Inappropriate Content
I'm go through the document and find the Binning is the best for me I loaded the table but I don't know how to use it with idevio map, do you have any example
- Mark as New
- Bookmark
- Subscribe
- Mute
- Subscribe to RSS Feed
- Permalink
- Report Inappropriate Content
Hi Mahmoud,
Check out the connector examples here, there is one for binning:
Guides & Examples « bi.idevio.com
Thanks,
Patric Nordström
Qlik
- Mark as New
- Bookmark
- Subscribe
- Mute
- Subscribe to RSS Feed
- Permalink
- Report Inappropriate Content
Hi Patric ,
That's what I'm searching about but unfortunately all links Example not working
- Mark as New
- Bookmark
- Subscribe
- Mute
- Subscribe to RSS Feed
- Permalink
- Report Inappropriate Content
IE user? Use Save target as … to download, rename to .qvf file, place the qvf file in Sense Apps folder. Although the examples are made with Qlik Sense the load script code will work in QlikView too.
- Mark as New
- Bookmark
- Subscribe
- Mute
- Subscribe to RSS Feed
- Permalink
- Report Inappropriate Content
Hi Patric ,
What If customer need to load all 200 K point on the map without using neither drill down nor cluster, so the idevio map get hang
I asked to increase the memory to 32 GB also, it get hang
Please advise
Many Thanks
- Mark as New
- Bookmark
- Subscribe
- Mute
- Subscribe to RSS Feed
- Permalink
- Report Inappropriate Content
Well, I wouldn't recommend it but it will eventually render.
It's of course much better to moderate the information density to be constant at all scale levels, here's nice example of US traffic incidents, shown on incident, hex bin, and county level.
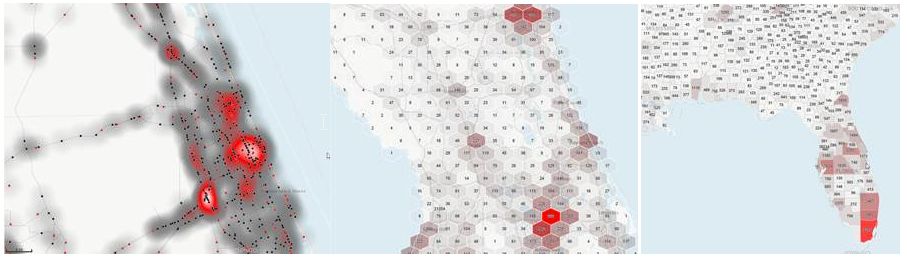
Nice to look at, fluid to interact with and renders quickly. Built with the Binning and SpatialIndex operations.
See the live demo at qlikdemo.idevio.com
Thanks,
Patric