Unlock a world of possibilities! Login now and discover the exclusive benefits awaiting you.
- Qlik Community
- :
- All Forums
- :
- Qlik NPrinting
- :
- NPRINTING IMAGES Mispresented
- Subscribe to RSS Feed
- Mark Topic as New
- Mark Topic as Read
- Float this Topic for Current User
- Bookmark
- Subscribe
- Mute
- Printer Friendly Page
- Mark as New
- Bookmark
- Subscribe
- Mute
- Subscribe to RSS Feed
- Permalink
- Report Inappropriate Content
NPRINTING IMAGES Mispresented
Hi,
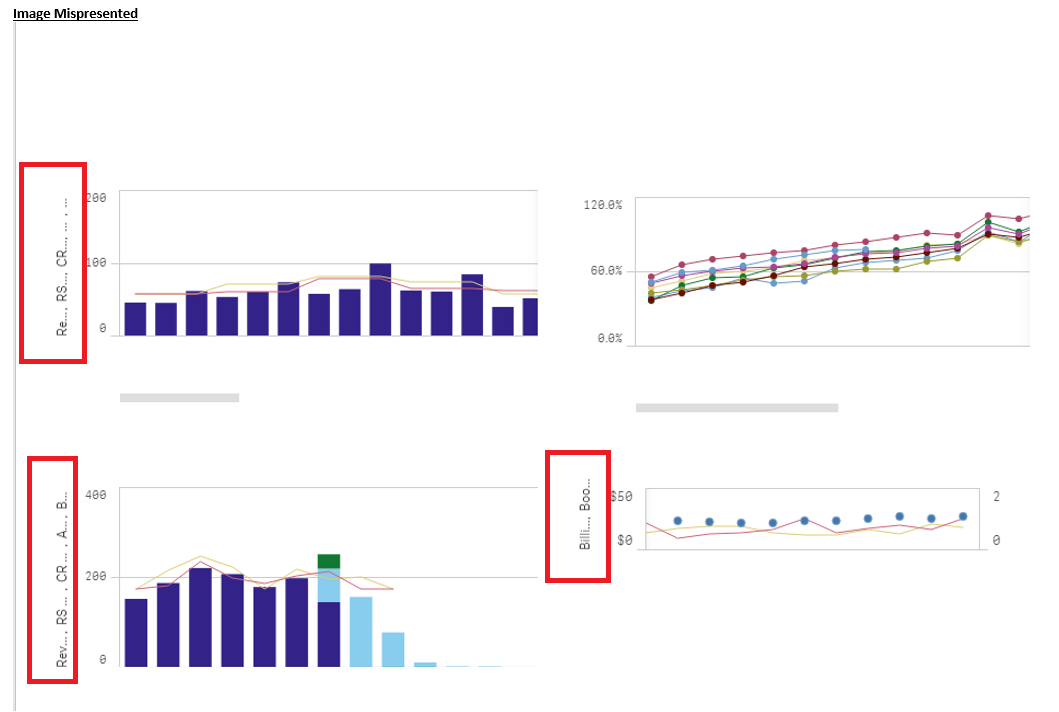
I am include multiple images into one slide of ppt, by stretch the image to smaller size.
I am select Fit Inside for all the images. But the output of the result all the images on the slide misrepresented.
Please help to advise what need to done so all images display correctly in one slide.
Thanks
Steve
- Mark as New
- Bookmark
- Subscribe
- Mute
- Subscribe to RSS Feed
- Permalink
- Report Inappropriate Content
This is a result of Qlik Sense responsive design. It is not really specific to NPrinting but to resolution in which your charts are rendered.
Please study help document on how to resize Qlik Sense images and how to deal with Image quality.:
- Mark as New
- Bookmark
- Subscribe
- Mute
- Subscribe to RSS Feed
- Permalink
- Report Inappropriate Content
I have read the help file mentioned and also watched videos about image sizing. I understand the options available in properties but I am unable to figure out how to know what to put for pixel sizes. Is there somewhere in the qlik sense app where I can find the size of the visual I want in pixels as it is displayed on the screen? I know to get the object id of a visual in the qlik sense app that I can add /options/developer onto the url. Is the pixel size of the visual to be located somewhere?
If I can find out what the original image size is in pixels - then I can get an idea what to put in the Data Displayed Width (px) and Data Displayed Height (px) to adjust how much chart data is displayed in the report.
- Mark as New
- Bookmark
- Subscribe
- Mute
- Subscribe to RSS Feed
- Permalink
- Report Inappropriate Content
Hi, there is no such a thing like original image size in this case. If you have 4K monitor and your chart takes 1/4th of the screen object would be still rendered in Full HD resolution (1920 x 1080)-as this is 1/4 of your 4K screen, now if you open the same app on older PC/Laptop with resolution 1366 x 768 your object will greatly reduced and probably will not have labels on axis at all.
The same behaviour can be observed when zooming in and out your browser zoom.
I hate working with images for the same reason as they will never be PixelPerfect when coming from Qlik Sense. But rough estimate can be done purely by assumption of how much screen chart takes on your screen and what is your screen resolution. See the image below:
- Check what is your screen resolution
- Make sure browser zoom is set to 100
- Open Qlik Sense and check roughly how much space your object takes - is it whole grid, 1/4 etc...
- If you have 4K screen and table which takes 1/4 of height and full width you would put 3840 width and 540 height as your pixels. Remember that when considering height you need to account for browser URL bar, Bookmark tab row, Qlik Sense current selection row, Qlik Sense sheet name row etc.. which take some real estate of screen depending on your setup

hope it makes sense.
the other method could by using tools like screenruler....