Unlock a world of possibilities! Login now and discover the exclusive benefits awaiting you.
- Qlik Community
- :
- All Forums
- :
- Qlik NPrinting
- :
- PPT chart in nPrinting by aggregating column value...
- Subscribe to RSS Feed
- Mark Topic as New
- Mark Topic as Read
- Float this Topic for Current User
- Bookmark
- Subscribe
- Mute
- Printer Friendly Page
- Mark as New
- Bookmark
- Subscribe
- Mute
- Subscribe to RSS Feed
- Permalink
- Report Inappropriate Content
PPT chart in nPrinting by aggregating column values
Hi,
Please help us with the below query in nPrinitng. We are on a very stringent timeline and any help at the earliest will be highly appreciated.
I am trying to create the below shown bar chart in PPT using nPrinting.
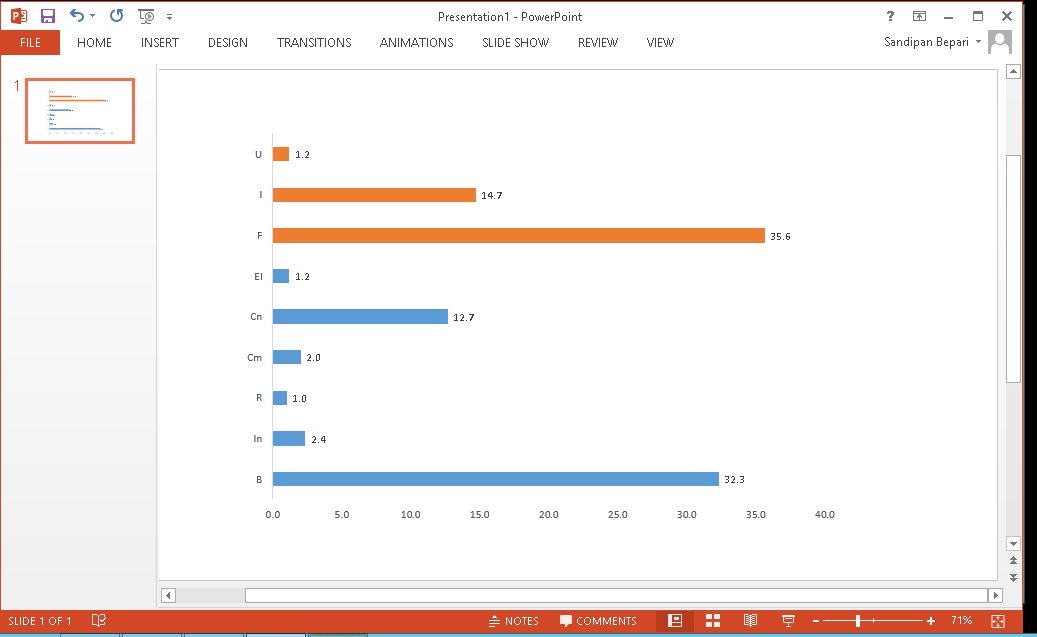
The data for the given chart is as below
Column1 | Column2 | Value |
F | B | 32.28349061 |
F | In | 2.354230797 |
F | R | 1.001463105 |
I | Cm | 2.010747889 |
I | Cn | 12.67959864 |
U | El | 1.197299814 |
Note:
- The output chart should have all six Column2 (blue bars) along with aggregated values of three Column1(red bars)
- We want to create the above PPT output without making any modifications in QVW file
- We tried to write aggregation formula for each value and drag them in the chart backend excel data file, but formulae doesn't work in this case
Thanks in advance!
Sandy
- Mark as New
- Bookmark
- Subscribe
- Mute
- Subscribe to RSS Feed
- Permalink
- Report Inappropriate Content
Hi,
I would create a new QlikView document with a binary reload on your existing document. You will have all the data in your new QlikView file. You can build in this document the tables and graphs you want.
You can use those objects in your nPrinting report.
Wouter