Unlock a world of possibilities! Login now and discover the exclusive benefits awaiting you.
- Qlik Community
- :
- Support
- :
- Support
- :
- Knowledge
- :
- Member Articles
- :
- How to Create a Well Formatted PixelPerfect Chart
- Edit Document
- Move Document
- Delete Document
- Subscribe to RSS Feed
- Mark as New
- Mark as Read
- Bookmark
- Subscribe
- Printer Friendly Page
- Report Inappropriate Content
How to Create a Well Formatted PixelPerfect Chart
- Move Document
- Delete Document
- Mark as New
- Bookmark
- Subscribe
- Mute
- Subscribe to RSS Feed
- Permalink
- Report Inappropriate Content
How to Create a Well Formatted PixelPerfect Chart
Description: Learn how to create a PixelPerfect Chart based on QlikView data. The new chart imports data from a QlikView document but does not exist in QlikView. The chart is created in the report. Learn also how to set advanced graphic attributes.
If you haven't recently done so, download the latest version of Vizubi NPrinting Training environment available via the NPrinting Training Material Page. See the following link for download instructions: NPrinting Training Material
Create New Report and Template
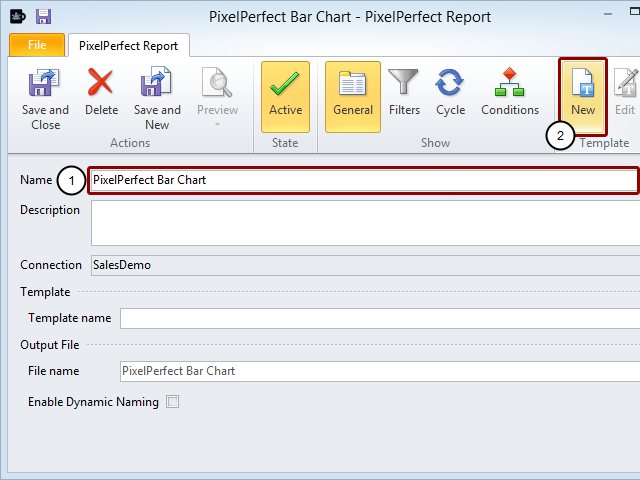
- Enter PixelPerfect Bar Chart as the report Name
- Click on the New icon in the Template group of the tool bar
Set Template Scale to Pixels
- Click on the triangle at the corner between the two rulers
- Go to the Measure Units menu item
- Open the drop-down menu by clicking on the down pointing triangle at the extreme right of the field
- Select Pixels
Configure Workspace Format
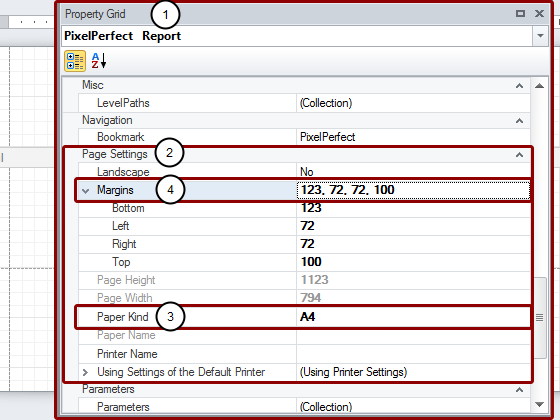
- Go to the Property Grid, which is usually docked at the lower left of the work area but can be enlarged and floated to any convenient position in the workspace or even docked on another side
- Go down to the Page Settings group of attribute controls
- Change the Paper Kind to the size that you normally use
- Set Margins as appropriate (the Margins node has been expanded here so that you can see the unconventional order)
Make Room in Template Workspace
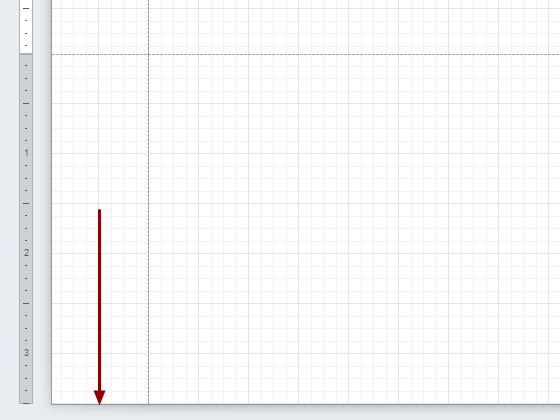
Drag the bottom border of the template down to the 350 pixel mark.
Add Object to Template as Table
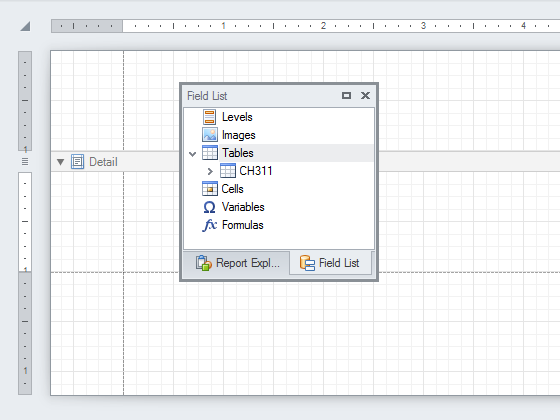
Add CH311 to the Tables node.
Embed Chart Object

Drag the Chart object from the Tool Box into the template and drop it into the upper left corner of the Detail range aligned with the left margin and the bottom border of the Detail bar. The Chart Wizard opens automatically to the Chart Type page.
Select Chart Type
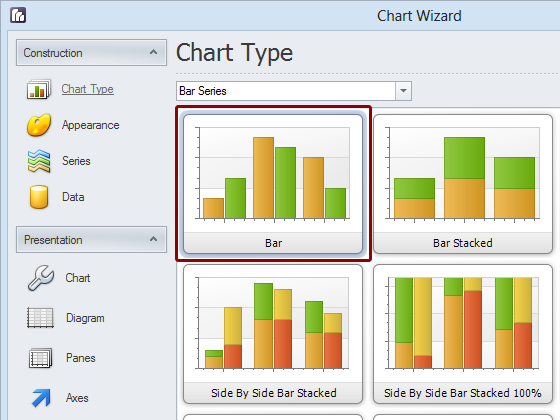
Select Bar for the Chart Type and click on the Next >> button at the bottom of the window. This moves you to theAppearance page.
Select Color Palette
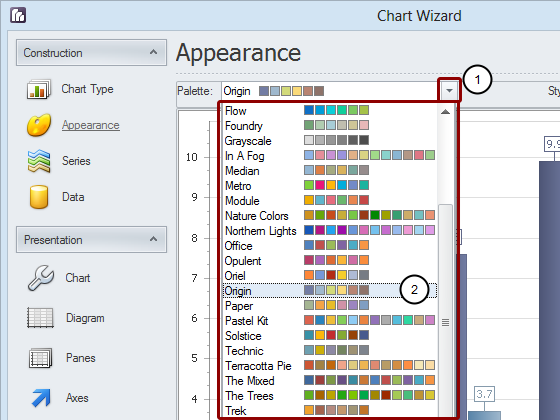
- Open the Palette drop-down menu
- Select the color palette that looks best. The Origin palette has been chosen here.
- Click on the Next >> button at the bottom of the window
Create and Configure Series
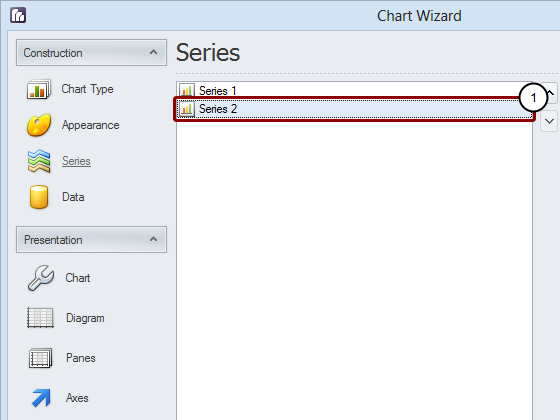
- Select Series 2
- Click on the Remove button at the bottom of the Series pane
Configure Series 1

- Enter Sales for the Series name
- Set Point sort order to Ascending
- Set Sort points by to Value
Configure Legend Points
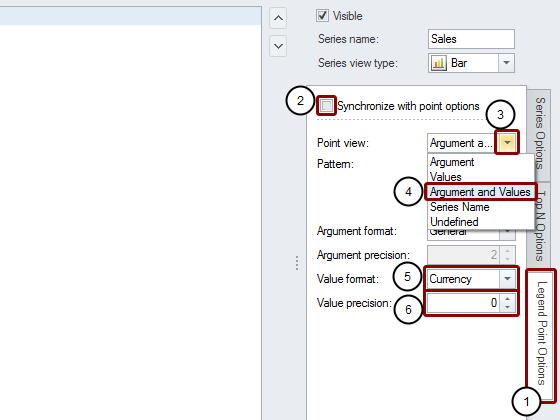
- Select the Legend Point Options tab
- Deselect Synchronize with point options
- Open the Point view drop-down menu
- Select Argument and Values
- Set Value format to Currency
- Set Value precision to 0, this sets the number of significant digits to the right of the decimal point to none
- Click on the Next >> button at the bottom of the window
Bind Argument

- Select the Series Binding tab
- Open the Argument drop-down menu in the Argument Properties box
- Expand the CH311 node
- Select CategoryName node
Bind Value
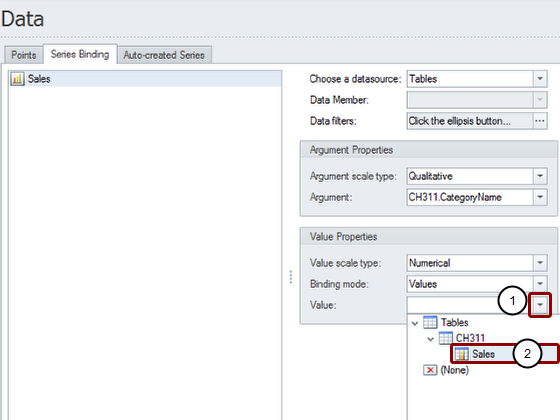
- Open the Value field drop-down menu under Value Properties
- Select the Sales node under the CH311 node
- Click on the Next >> button at the bottom of the window
Explore Chart Page
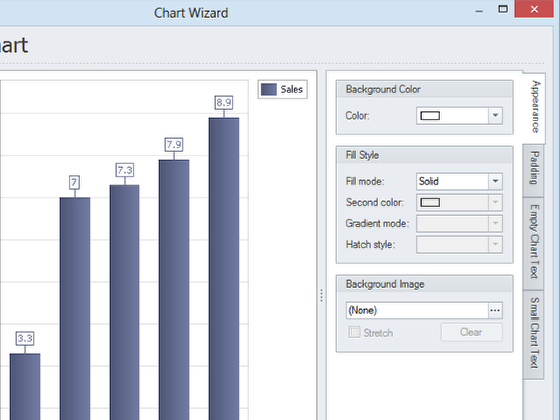
The Chart page provides controls for appearance attributes such as background color, padding (internal distance of content from margins), text in empty and small charts. Explore various values, but the predefined settings are used for this tutorial. Click on the Next >> button.
Change Diagram Orientation

- Put a check mark in the Rotated box so that the bars will be displayed horizontally
- Click on the Next >> button
Inspect Panes Page
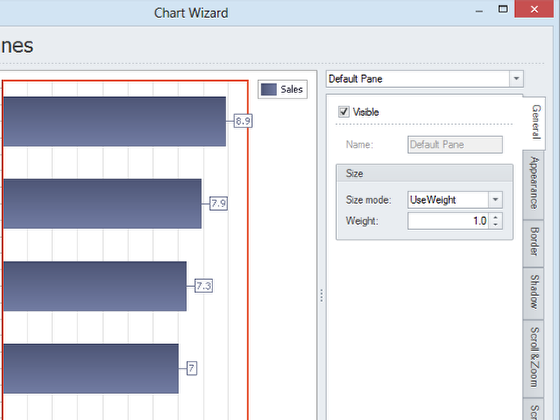
Have a look at the Panes page but leave the default settings. Click on the Next >> button.
Label X Axis
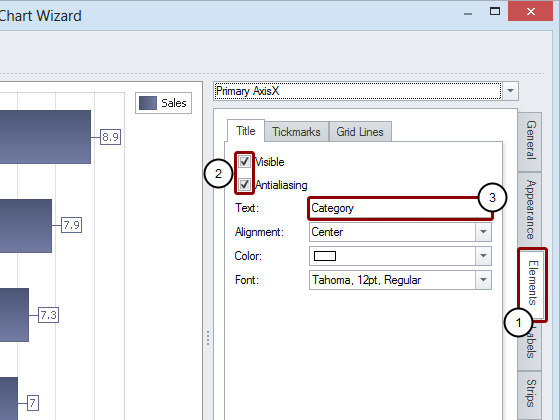
- Select the Elements tab on the right
- Put a check mark in the Visible box. Antialiasing will also be activated automatically
- Enter Category in the Text field, it appears on the vertical axis because the diagram has been rotated
Label Y Axis

- Change from Primary AxisX to Primary AxisY in the drop-down menu at the top
- Make sure the Elements tab on the right is still selected
- Put a check mark in the Visible box. Antialiasing will also be activated automatically
- Enter Sales in the Text field, it appears on the horizontal axis because the diagram has been rotated
Format Label Content
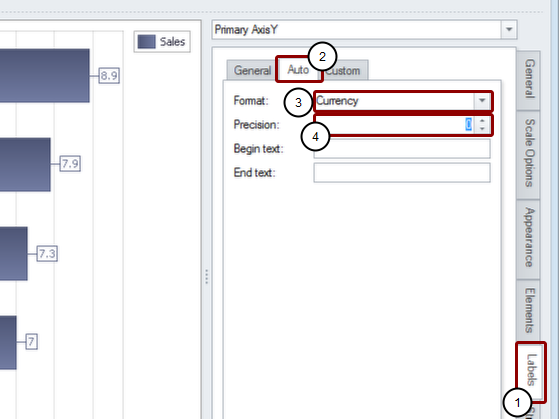
- Select the Labels tab on the right
- Select the Auto tab
- Set Format to Currency
- Set Precision to 0
- Click on the Next >> button
Set Bar Color
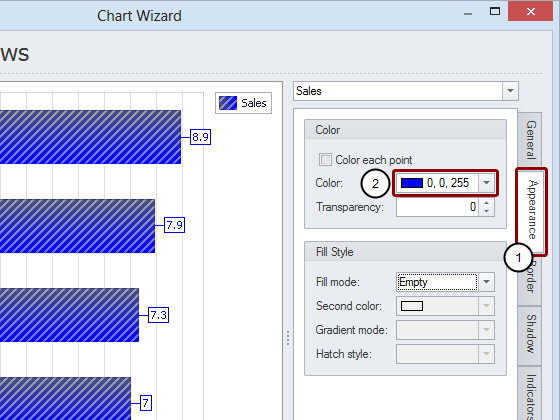
- Select the Appearance tab on the right
- Select pure, saturated blue (0; 0; 255) from the Color drop-down menu
- Click on the Next >> button
Antialias Point Labels
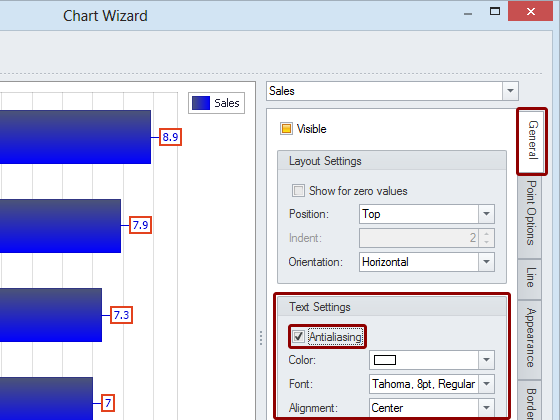
Customize point display on the Point Labels page.Put a check mark in the Antialiasing box under Text Settings on the General tab
Configure Point Label Content
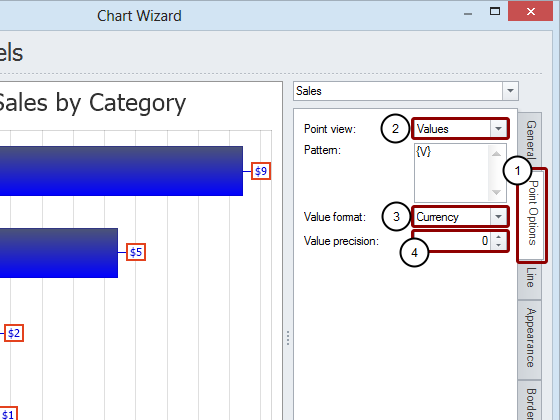
- Select the Point Options tab
- Leave Point view set to Values
- Select Currency for Value format
- Set Value precision to 0
- Click on the Next >> button
Add Chart

- Click on the Add button to create a new title
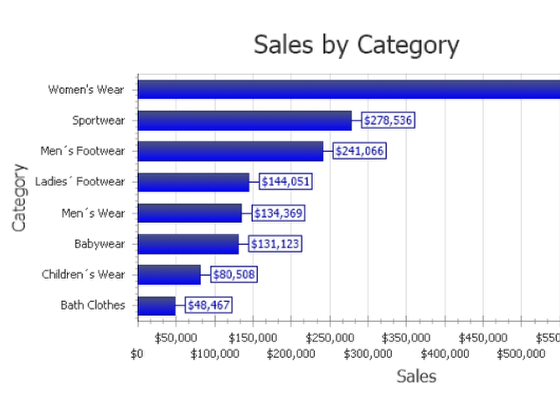
- Enter Sales by Category as the heading
- Click on the Next >> button
Render Legend Invisible
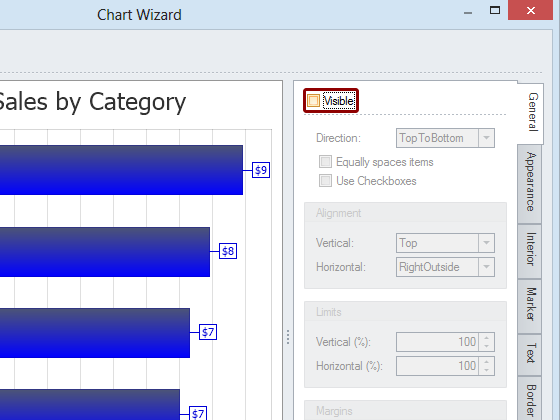
Configure a chart legend on the Legend page. Set whether or not a legend is displayed and how. A legend is unnecessary for this simple chart so make sure that there is no check mark in the Visible box.Click on the Next >> button.
Add No Annotations
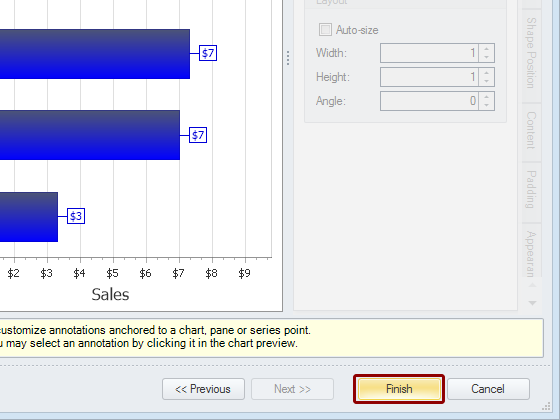
No Annotations are to be added. Click on the Finish button to close the Chart Wizard.
Adjust Chart Size
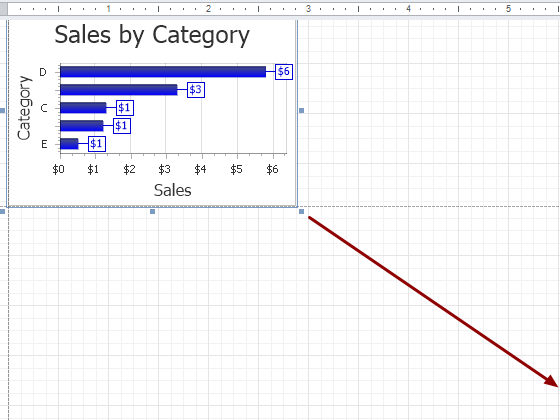
Drag the bottom right corner of the chart to fill all the available space.
Open Save As Window
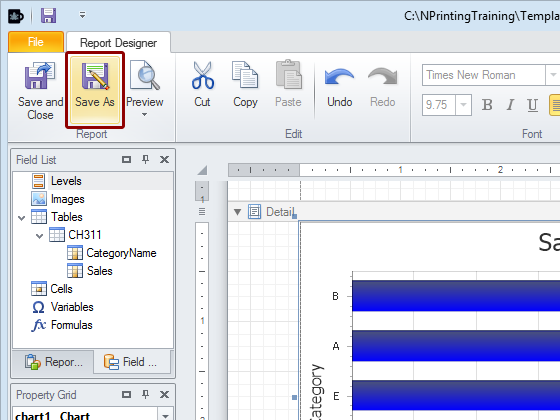
Click on the Save As icon in the Report group of the tool bar.
Save Template

- Make sure the Save As window is open in the C:\NPrintingTraining\Templates folder
- Enter an appropriate File name or accept the suggested one: PixelPerfect Bar Chart.npx
- Click on the Save button
Run Preview

Click on the upper part of the Preview button.
Inspect Report