Unlock a world of possibilities! Login now and discover the exclusive benefits awaiting you.

- Qlik Community
- :
- All Forums
- :
- Qlik NPrinting
- :
- How to Create Text file from multiple straight tab...
- Subscribe to RSS Feed
- Mark Topic as New
- Mark Topic as Read
- Float this Topic for Current User
- Bookmark
- Subscribe
- Mute
- Printer Friendly Page

 zeeshanadeel
- Mark as New
- Bookmark
- Subscribe
- Mute
- Subscribe to RSS Feed
- Permalink
- Report Inappropriate Content
How to Create Text file from multiple straight tables in NPrinting
I would like to create a text file from two different charts / straight tables.
Both charts have different columns and values.
In this file I don't have to have any header row and the separator should be '~'.
I read that it can be achieved through PixelPerfect report but I don't know how. It would be great if someone please guide me on this. An example would be great. Thanks!
- « Previous Replies
-
- 1
- 2
- Next Replies »

 Daniel_Jenkins
- Mark as New
- Bookmark
- Subscribe
- Mute
- Subscribe to RSS Feed
- Permalink
- Report Inappropriate Content
Hi Zeeshan,
The QlikView NPrinting Training Material has an example. Check the report called PixelPerfect Report to CSV. This report exports multiple tables to a single CSV file. Add it to a task, set the Output Format to Csv and change the separator to '~' under the Advanced options. Run the task.
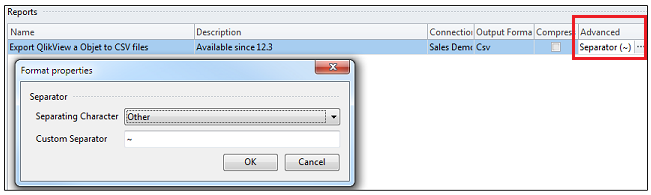
HTH - Daniel

- Mark as New
- Bookmark
- Subscribe
- Mute
- Subscribe to RSS Feed
- Permalink
- Report Inappropriate Content
Daniel,
This is good information to know. I went and looked at the Excel output for a task and CSV is not even an export choice. Seem odd that you can export Pixel Perfect to CSV and not EXCEL. Did that get resolved in version 17 or am I missing something here?
- « Previous Replies
-
- 1
- 2
- Next Replies »