Unlock a world of possibilities! Login now and discover the exclusive benefits awaiting you.
- Qlik Community
- :
- All Forums
- :
- Qlik NPrinting
- :
- How to show label from "select range" in PowerPoin...
- Subscribe to RSS Feed
- Mark Topic as New
- Mark Topic as Read
- Float this Topic for Current User
- Bookmark
- Subscribe
- Mute
- Printer Friendly Page
- Mark as New
- Bookmark
- Subscribe
- Mute
- Subscribe to RSS Feed
- Permalink
- Report Inappropriate Content
How to show label from "select range" in PowerPoint chart using Nprinting 17
Hi, I have a table in a Qlik Sense App with two measures, one in an Amount Form and the other in a Percentage Form. I would like to create a PowerPoint Report using Nprinting 17: I need to create a bar chart with a double data labels (both amount and percentage form);
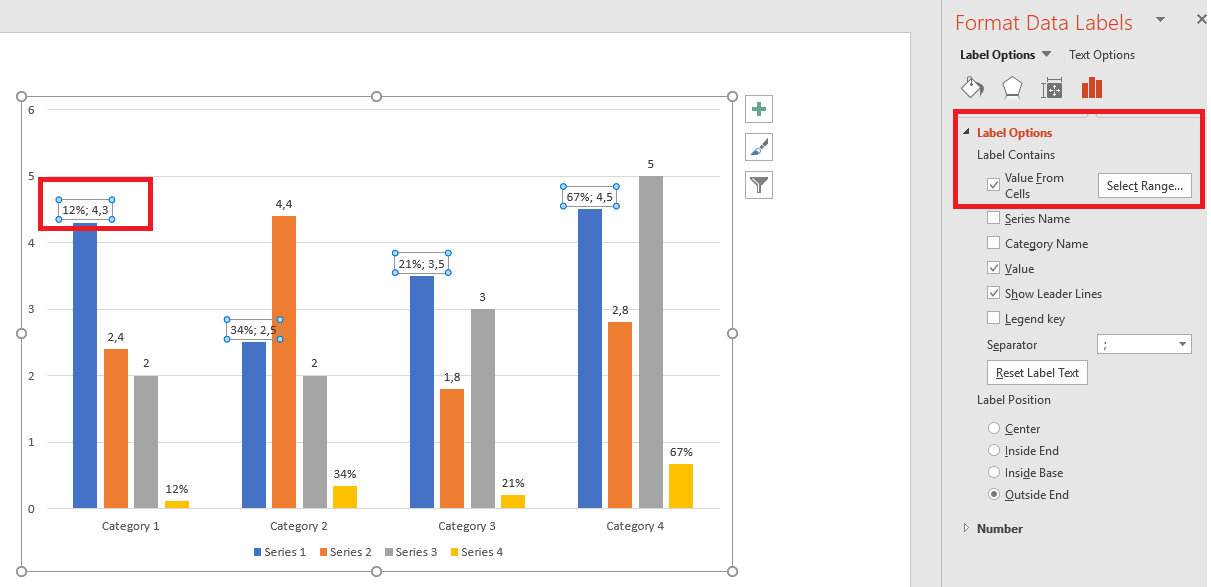
to do this, I select percentage set in Labels Option->Value From Cells but report's generation causes Power Point crash.
How can I solve this problem?
- Tags:
- qlik nprinting17
- Mark as New
- Bookmark
- Subscribe
- Mute
- Subscribe to RSS Feed
- Permalink
- Report Inappropriate Content
I try to give you some details:
I am using qliksenseserver 12.5.2 (February 2018), Nprinting February 2018 SR1 Version: 18.0.4, Power Point 2016.
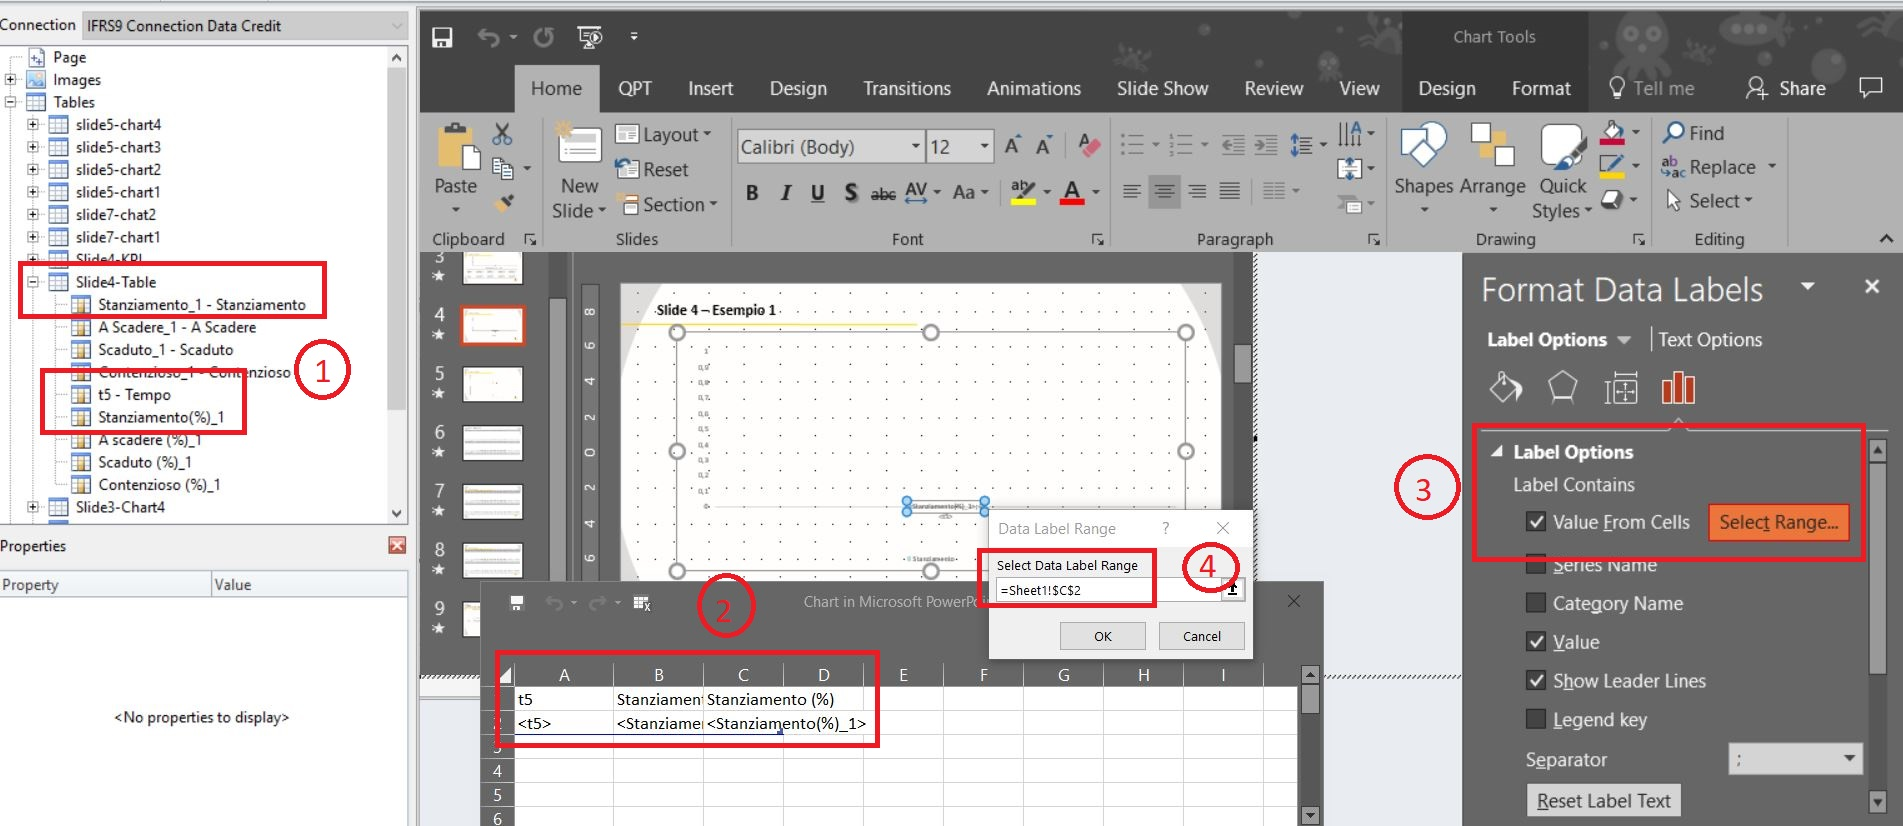
1. I loaded my table in Nprinting; in this example, my measures are Stanziamento_1 and Stanziamento(%)_1; t5 is my dimension;
2. I created a bar chart in my ppt template using Nprinting tag for dimension t5 and measure Stanziamento_1;
3. In Format Data Labels -> Label Option, I inserted Stanziamento(%)_1 in Value From Cells (4).
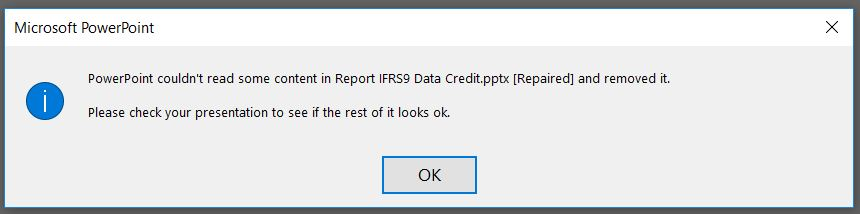
After report's extraction the following error is generated:
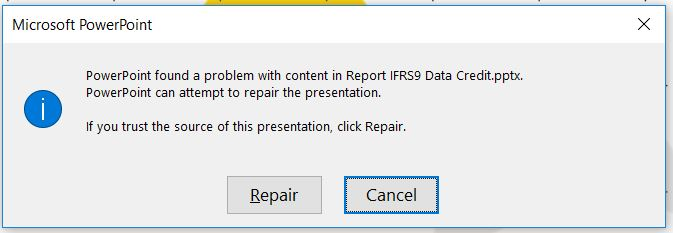
I tried to click on repair button but at the end slide 4 in my ppt is a blank sheet.
- Mark as New
- Bookmark
- Subscribe
- Mute
- Subscribe to RSS Feed
- Permalink
- Report Inappropriate Content
Is it possible that your % values are not numbers (but they are exported as a text and therefore MsPowerPoint cannot use it in a chart?
If i were you i would start by extracting this table to NPrinitng Excel report to see how data is shown when landing in excel. I am 100 sure you will get little green triangle when you export it to excel suggesting your data is not a number but text.,...
Then you would have to make sure that the format in Qlik is numeric...
- Mark as New
- Bookmark
- Subscribe
- Mute
- Subscribe to RSS Feed
- Permalink
- Report Inappropriate Content
No, my measure is a number, I used this measure in an other bar chart and extraction is perfect! In the chart's excel source my values are numbers. Anyway, thanks for your answer. Other suggestions?
- Mark as New
- Bookmark
- Subscribe
- Mute
- Subscribe to RSS Feed
- Permalink
- Report Inappropriate Content
well,
in this case we might need little bit more help from you.
- whiuch exact version of NPrinitng and Qlik are you using (provide SR versions too as they differ)
- any chance we can mock up your solution and try to recreate problem
- sharing of the template and reduced version of Qlik app would be a help
On weekend i might be able to try to replicate this issue.
regards
Lech