Unlock a world of possibilities! Login now and discover the exclusive benefits awaiting you.

- Qlik Community
- :
- All Forums
- :
- Qlik NPrinting
- :
- Re: NPrinting Charts
- Subscribe to RSS Feed
- Mark Topic as New
- Mark Topic as Read
- Float this Topic for Current User
- Bookmark
- Subscribe
- Mute
- Printer Friendly Page

 neerajthakur
- Mark as New
- Bookmark
- Subscribe
- Mute
- Subscribe to RSS Feed
- Permalink
- Report Inappropriate Content
NPrinting Charts
HI,
I have made a native chart in NPrinting and in Preview , I am only getting the Chart Title, object id is used from QlikSense Donut Chart added as Table in NPrinting, before preview in Designer, I am getting wrong values too.
Can someone suggest me where can be the error and how to correct it?


Please Accepts as Solution if it solves your query.
Accepted Solutions

 Frank_S
- Mark as New
- Bookmark
- Subscribe
- Mute
- Subscribe to RSS Feed
- Permalink
- Report Inappropriate Content
I checked and could not reproduce the issue.
- Below left is the Qlik Sense and Pie Charts
- Right is Output from PxP report
- Bottom of image is NP PxP report Template
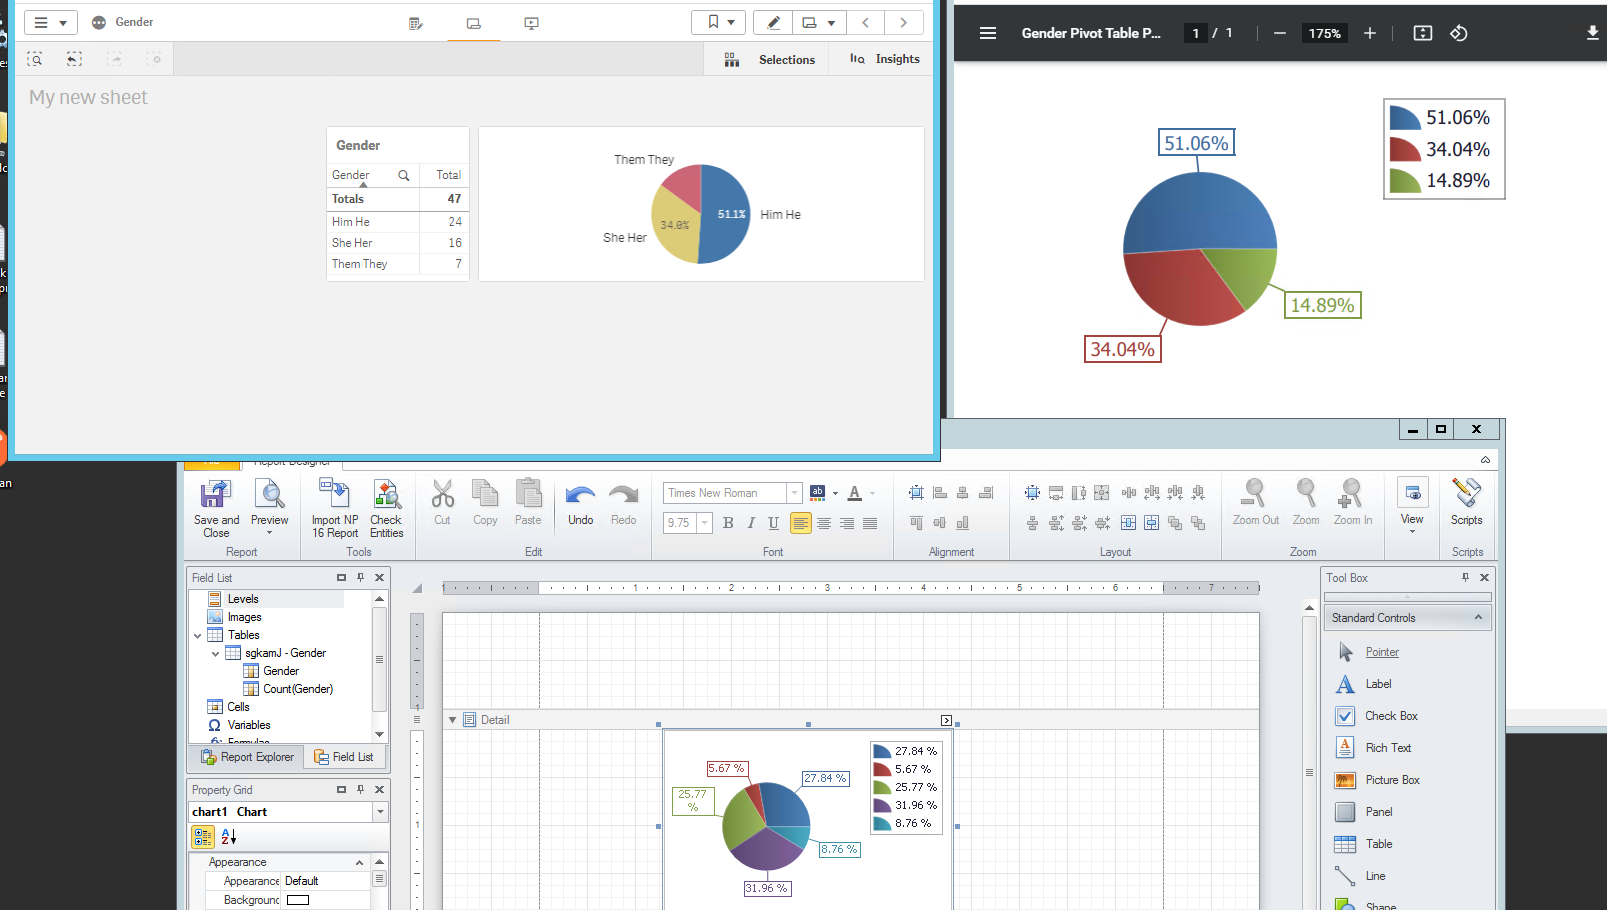
I have attached the NP report and source data as well in the next comment.
Kind regards...
neerajthakur
- Mark as New
- Bookmark
- Subscribe
- Mute
- Subscribe to RSS Feed
- Permalink
- Report Inappropriate Content
Hi, Thanks for helping,
I have identified the problem as formatting issue in QlikSense App itself it was getting formatted as Text than number after changing it chart is showing correct value for male and female only last row is not available where gender is null and No. of Visitors is 1.
Please Accepts as Solution if it solves your query.
 Ruggero_Piccoli
- Mark as New
- Bookmark
- Subscribe
- Mute
- Subscribe to RSS Feed
- Permalink
- Report Inappropriate Content
Hi,
It is not clear to me how you created the native PixelPerfect chart. Can you post more screenshots also with the Tables node expanded? Can you show in which bad it is placed?
You can refer to https://help.qlik.com/en-US/nprinting/May2021/Content/NPrinting/PixelPerfectReports/Create-Charts.ht...
Best Regards,
Ruggero
Best Regards,
Ruggero
---------------------------------------------
When applicable please mark the appropriate replies as CORRECT. This will help community members and Qlik Employees know which discussions have already been addressed and have a possible known solution. Please mark threads with a LIKE if the provided solution is helpful to the problem, but does not necessarily solve the indicated problem. You can mark multiple threads with LIKEs if you feel additional info is useful to others.
Frank_S
- Mark as New
- Bookmark
- Subscribe
- Mute
- Subscribe to RSS Feed
- Permalink
- Report Inappropriate Content
I checked and could not reproduce the issue.
- Below left is the Qlik Sense and Pie Charts
- Right is Output from PxP report
- Bottom of image is NP PxP report Template
I have attached the NP report and source data as well in the next comment.
Kind regards...
Frank_S
- Mark as New
- Bookmark
- Subscribe
- Mute
- Subscribe to RSS Feed
- Permalink
- Report Inappropriate Content
Sample data and report attached.
Keep in mind that this report was created with NPrinting April 2020 and should not be used for production purposes. It should only be used as a comparison tool.
neerajthakur
- Mark as New
- Bookmark
- Subscribe
- Mute
- Subscribe to RSS Feed
- Permalink
- Report Inappropriate Content
Hi, Thanks for helping,
I have identified the problem as formatting issue in QlikSense App itself it was getting formatted as Text than number after changing it chart is showing correct value for male and female only last row is not available where gender is null and No. of Visitors is 1.
Please Accepts as Solution if it solves your query.
