Unlock a world of possibilities! Login now and discover the exclusive benefits awaiting you.
- Qlik Community
- :
- All Forums
- :
- Qlik NPrinting
- :
- Re: NPrinting- level with null values-how to hide/...
- Subscribe to RSS Feed
- Mark Topic as New
- Mark Topic as Read
- Float this Topic for Current User
- Bookmark
- Subscribe
- Mute
- Printer Friendly Page
- Mark as New
- Bookmark
- Subscribe
- Mute
- Subscribe to RSS Feed
- Permalink
- Report Inappropriate Content
NPrinting- level with null values-how to hide/move it
Hi everyone,
I need a little help.
I am creating an excel report in NPrinting (April 2018 version).
Because of sparkline tool I am using level for every row. And now I am faced with a new problem.
Using level, I don't have values in table for all values of level. So I am getting empty rows. How can I remove rows with no values?
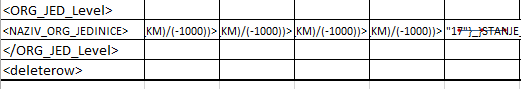
ORG_JED_Level is level for every row. It has values (506, 306, 555 etc.) This level is connected in a database with value of NAZIV_ORG_JEDINICE.
But in a created table in Qlik Sense, I don't have values for all ORG_JED.
When I put ORG_JED like a level, I get this result.
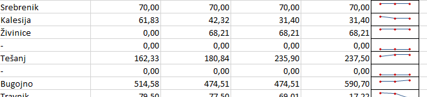
Look, it is going Srebrenik, then Kalesija, then Živinice and then nothing... Because for this level (ORG_JED) I don't have values.
How can I remove it, or hide, or something other...
Thank you very much for answer.
Kind regards,
Jasmina
- Mark as New
- Bookmark
- Subscribe
- Mute
- Subscribe to RSS Feed
- Permalink
- Report Inappropriate Content
Hello Jasmina,
Are you using Qlik NPrinting with QlikView or Qlik Sense?
If QlikView here is a Community Post on how to display NULL Values as NULL:
Please let us know if that helps with your question.
Regards,
Eva
- Mark as New
- Bookmark
- Subscribe
- Mute
- Subscribe to RSS Feed
- Permalink
- Report Inappropriate Content
Dear Jasmina,
Did you get a solution for this issue (hide/remove empty rows) as I am also facing the same issue.
Regards,
Irshad
- Mark as New
- Bookmark
- Subscribe
- Mute
- Subscribe to RSS Feed
- Permalink
- Report Inappropriate Content
this is not really nprinting question.
It is just a question on your data model and what values are returned... To control that you may need to use different expressions so your sparklines produce values only for dimension values where there are other measures...
you can apply advanced search filter on data set to exclude values you need. https://nprintingadventures.com/2019/06/26/nprinting-filters-part-3-advanced-search/
To be honest - I would be interested to see how the source table for the level looks like. Does it have 0 values suppressed or not and what is the expression for sparkline like.
- Mark as New
- Bookmark
- Subscribe
- Mute
- Subscribe to RSS Feed
- Permalink
- Report Inappropriate Content
Hello.
I face the same issue and unfortunately I found no solution nor workaround. And in my opinion, this is not a data model issue, actually.
I am working with levels (as a last resort) because I am really disappointed by the layout of the tables we get in excel with NPrinting, when the object is extracted from a Qlik Sense application.
We used to work with QlikView applications and we had no problem: we created many NPrinting reports in Excel with pivot tables and straight tables, and it was just easy: drag and drop the object name in the excel sheet and you get a well-formatted table without doing any particular set-up. The excel report just looked like the QlikView object. All the formatting work we did in QlikView was automatically applied in Excel.
Font, cell borders, background colors, position of the totals and subtotals and so on: all was automatically set in Excel.
Now we are reworking these reports because the data source is Qlik Sense instead of Qlik View. And the result is pitiful.
In addition to cell formatting in excel, I have to struggle with levels in Nprinting to get an almost similar layout: having totals and subtotals at the right place, in bold, and with a deeper blue background color. But by doing this, my report is polluted with Null and 0 values. When we solve one issue, another one raises...
So I would have to review my whole data model to avoid this Null and 0 values, when there is an option - a single checkbox - to hide them in the table or pivot table properties in Qlik Sense? It doesn't make sense.
- Mark as New
- Bookmark
- Subscribe
- Mute
- Subscribe to RSS Feed
- Permalink
- Report Inappropriate Content
@phkilian - true with QlikView it was a lot easier and using QlikView with current version of NPrinting would do the same. There is no point complaining about it since technology used to produce reports from QlikView and Qlik Sense is totally different and they are different tools.
The original question was related to the fact that sparkline was having values against records whch dont have anything in dimension column or other measures. Those also in QlikView would not be suppresed, so my advice was to take it into account for expression used in sparkline.
Regardig rewriting objects from QlikView to Qlik Sense I know it is not easy - but I also say that you need to be experienced NPrinting developer and excelent Qlik Sense developer to know how to model your tables so they can produce complex looking tables (looking like pivot tables or similar) with nice formatting.
I went through a project which had very crazy formulas disqualifying many methods in NPrinting i would normally use (due to the fact that there were cumulative measures used with functions like "Above") which automaticaly meant there was no way I could use levels to create pivot table. Still with smart data modeling, creating flags and dedicated grouping dimensions I was able to build nice formatted tables using just striagt tables (no levels!).
I cannot really comment on the right solution for everything as there is no "one fit all" approach. Each scenarion is different and each scenario requires individual approach.
I am happy to comment or help you with your scenario - obviously as mentioned that will require detailed discussion and understanding of data model, objects and expressions used etc... If you wish to do so, you may want to prepare dummy app and example you want to work through and create new community post to do case study what is possible and what isn't.
Cheers
- Mark as New
- Bookmark
- Subscribe
- Mute
- Subscribe to RSS Feed
- Permalink
- Report Inappropriate Content
Hi,
Based on the screenshot you are using the field ORG_JED to create the level. This means that you will have a row for each distinct value of that field, also in case there are no data.
In the Levels node you can also add straight tables. So you can create a straight table that has rows only for values of ORG_JED with data (or the ones you want to see in the generated report), refresh the connection cache, close and re-open the Designer and create the level by adding that table.
I hope I had correctly understood your question.
Best Regards,
Ruggero
Best Regards,
Ruggero
---------------------------------------------
When applicable please mark the appropriate replies as CORRECT. This will help community members and Qlik Employees know which discussions have already been addressed and have a possible known solution. Please mark threads with a LIKE if the provided solution is helpful to the problem, but does not necessarily solve the indicated problem. You can mark multiple threads with LIKEs if you feel additional info is useful to others.
- Mark as New
- Bookmark
- Subscribe
- Mute
- Subscribe to RSS Feed
- Permalink
- Report Inappropriate Content
Hi @phkilian ,
I suggest to open a different conversation for different questions. Thanks.
Using levels causes a longer reports generation time so I suggest to avoid them when not needed. With sparklines you need them but in you case you could evaluate to use native Excel tables formatting features.

QlikView and Qlik Sense work in different ways so, in some cases, it is not possible to export the formatting rules.
Best Regards,
Ruggero
Best Regards,
Ruggero
---------------------------------------------
When applicable please mark the appropriate replies as CORRECT. This will help community members and Qlik Employees know which discussions have already been addressed and have a possible known solution. Please mark threads with a LIKE if the provided solution is helpful to the problem, but does not necessarily solve the indicated problem. You can mark multiple threads with LIKEs if you feel additional info is useful to others.