Unlock a world of possibilities! Login now and discover the exclusive benefits awaiting you.
- Qlik Community
- :
- All Forums
- :
- Qlik NPrinting
- :
- Nprinting Excel Report filter problem
- Subscribe to RSS Feed
- Mark Topic as New
- Mark Topic as Read
- Float this Topic for Current User
- Bookmark
- Subscribe
- Mute
- Printer Friendly Page
- Mark as New
- Bookmark
- Subscribe
- Mute
- Subscribe to RSS Feed
- Permalink
- Report Inappropriate Content
Nprinting Excel Report filter problem
Hi
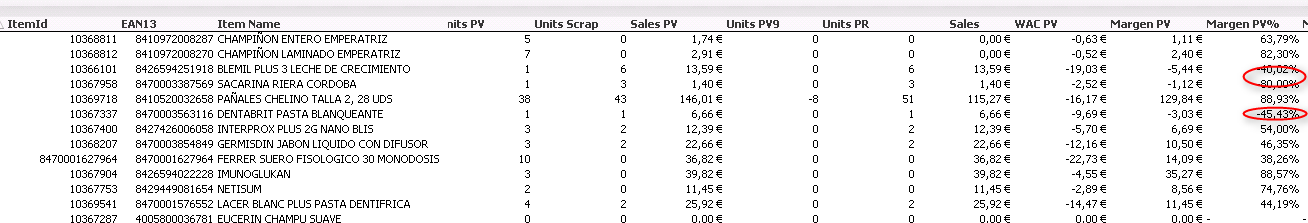
I have a table with margins in a Qliv document, I want to create a report in Nprinting but only showing the negative margins (It is a field calculated in QV not a dimension) not the positive, is it possible???
Many thank's
- Mark as New
- Bookmark
- Subscribe
- Mute
- Subscribe to RSS Feed
- Permalink
- Report Inappropriate Content
Eduard -
You best bet is to clone the QlikView object, and change the expression logic to an if statement so that only Margen PV% values less than zero appear in the QlikView table (this will also require you to suppress null values in the object).
From there, use the cloned object in your NPrinting template. The object can also be hidden in the QVW if you don't want to expose it to your users. NPrinting will still recognize the object and allow for its use in templates.
- Mark as New
- Bookmark
- Subscribe
- Mute
- Subscribe to RSS Feed
- Permalink
- Report Inappropriate Content
In addition to Stephens solid approach, here is a 'sneakier' approach you can use which involves the use of Excel Conditional formatting.
1. Open the template editor
2. Select the cell containing the NPrinting column tag and the cell directly beneath the cell containing the NPrinting tag
3. Click the 'toolbar' button to expose the Excel Menu options/ribbon
4. Click conditional formatting and choose the option to allow values greater or less than the value you wish to be formatted. In this case I choose values less than 5000.
5. Click the format button an select 'white' as the color.
6. Save the template and preview.
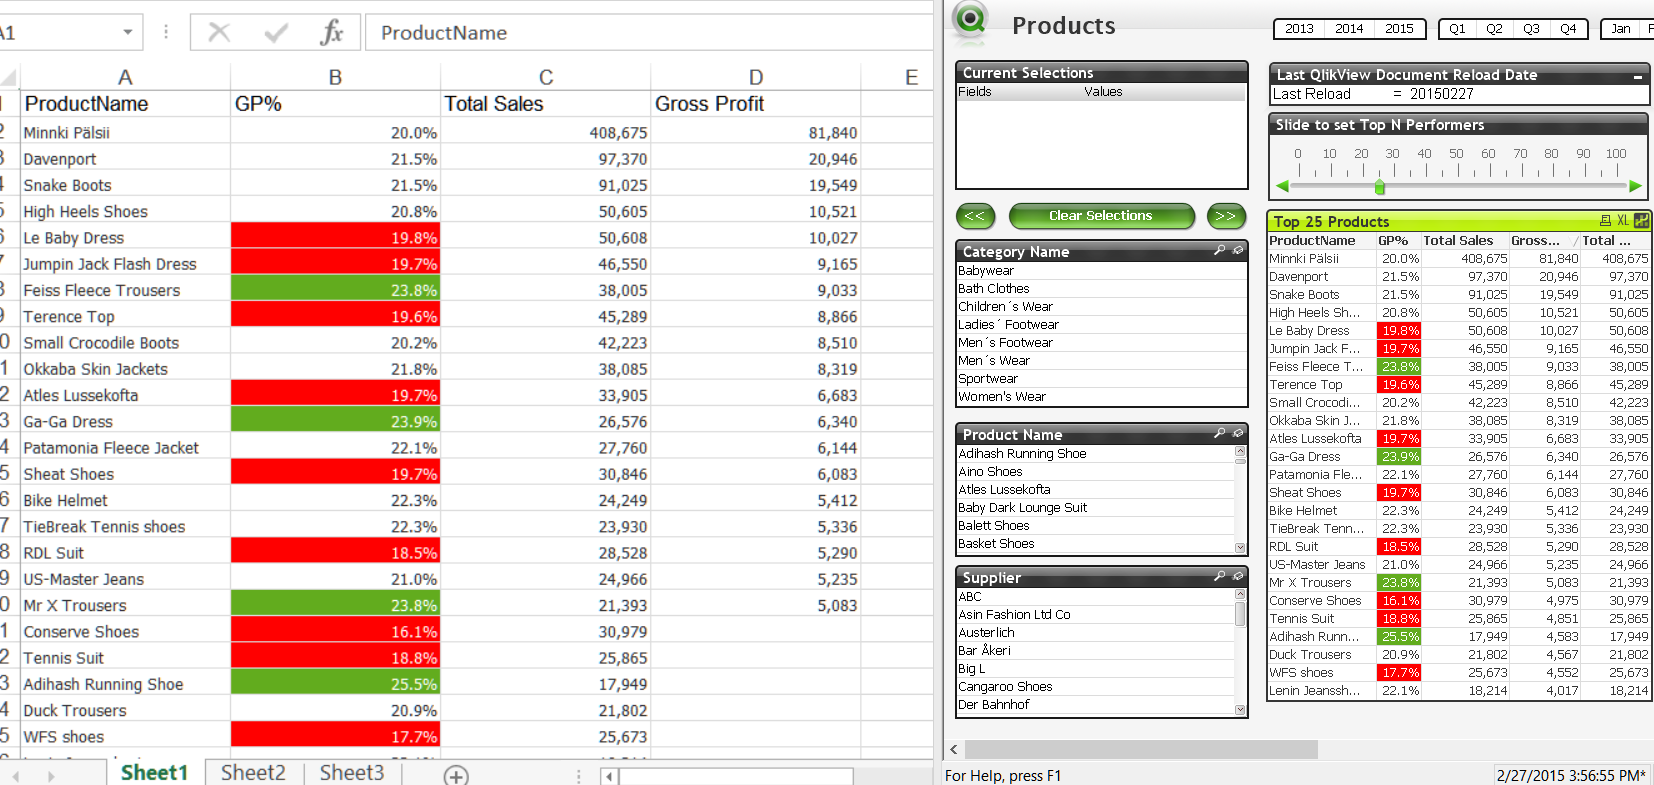
See output below. On the left in the gross profit field you seen that values are not seen because any value below 5000 has a white font and thus cannot be seen against the white background. On the right, is the source qvw chart "top 25 products"
You may extract the attached repository to the c:\drive to see how this is set up in detail.
*Note: this approach is for 'visual' context only. Thus PDF output would be the best choice as an output format. Hiding by coloring does not prevent the data from remaining in each excel cell formatted with 'white' font coloring.*
Hope this helps.