Unlock a world of possibilities! Login now and discover the exclusive benefits awaiting you.
- Qlik Community
- :
- All Forums
- :
- Qlik NPrinting
- :
- Pixelperfect : Bar chart - constant line
- Subscribe to RSS Feed
- Mark Topic as New
- Mark Topic as Read
- Float this Topic for Current User
- Bookmark
- Subscribe
- Mute
- Printer Friendly Page
- Mark as New
- Bookmark
- Subscribe
- Mute
- Subscribe to RSS Feed
- Permalink
- Report Inappropriate Content
Pixelperfect : Bar chart - constant line
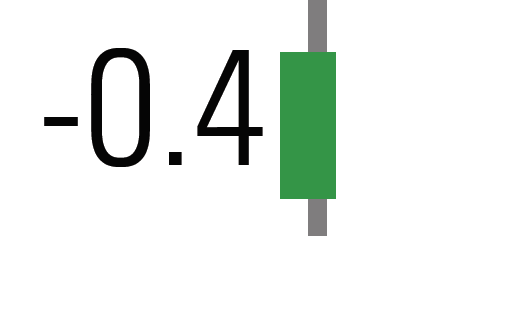
I have a rotated bar chart and I want to have a constant line at 0 across the Y axis. The constant line comes up good but I see the bars are overlapping and even going beyond constant line at 0. I mean, if the value is -0.4 it has some portion of the bar on the positive side of the constant line. Can anybody help me, why the charts behave like that?


- Mark as New
- Bookmark
- Subscribe
- Mute
- Subscribe to RSS Feed
- Permalink
- Report Inappropriate Content
Given that you are posting a question about your Qlik NPrinting Pixel Perfect template editor, your post has been move from Qlik (cloud) reporting to Qlik NPrinting Discussions.
Please note that this issue would need to be investigated by our R&D team in all likelihood.
Thus I would suggest that you start a support case, providing your QS or QVW to the support case along with an exported copy of your NPrinting Report.
Kind regards...
Thoughts?
- Mark as New
- Bookmark
- Subscribe
- Mute
- Subscribe to RSS Feed
- Permalink
- Report Inappropriate Content
Hello Frank,
Thanks for replying. The QS file requires a lot of approvals from the higher ups to be provided, that is why I posted a question as it was related to chart behavior, but if that is the only solution I will raise a request for those files.
- Mark as New
- Bookmark
- Subscribe
- Mute
- Subscribe to RSS Feed
- Permalink
- Report Inappropriate Content
just mockup dummy data - at the end you need few values for dimensions and few values for measure where some are negative - it doesn't have to be your production data for the case if problem is in pixelperfect charting library.
Something like
Load
a,
b
Inline
[a,b
x,2
y,3
z,-1
];
Issue is clear and should be easy to reproduce with dummy data if that indeed is PixelPerfect problem. You may provide additional info in form of versions of QlikVIew or Qlik Sense, NPrinting version and whether you are referring to this chart as an image from QlikView or Qlik Sense or if you are using build in library.
thanks
Lech
- Mark as New
- Bookmark
- Subscribe
- Mute
- Subscribe to RSS Feed
- Permalink
- Report Inappropriate Content
Hi,
You could give a check at the post https://community.qlik.com/t5/Qlik-NPrinting/PixelPerfect-Dynamic-constant-line-in-bar-chart/td-p/53...
If you want to add a trendline instead you can check https://community.qlik.com/t5/Qlik-NPrinting/How-to-put-a-trend-line-in-a-bar-chart-on-Pixel-Perfect...
Best Regards,
Ruggero
Best Regards,
Ruggero
---------------------------------------------
When applicable please mark the appropriate replies as CORRECT. This will help community members and Qlik Employees know which discussions have already been addressed and have a possible known solution. Please mark threads with a LIKE if the provided solution is helpful to the problem, but does not necessarily solve the indicated problem. You can mark multiple threads with LIKEs if you feel additional info is useful to others.
- Mark as New
- Bookmark
- Subscribe
- Mute
- Subscribe to RSS Feed
- Permalink
- Report Inappropriate Content
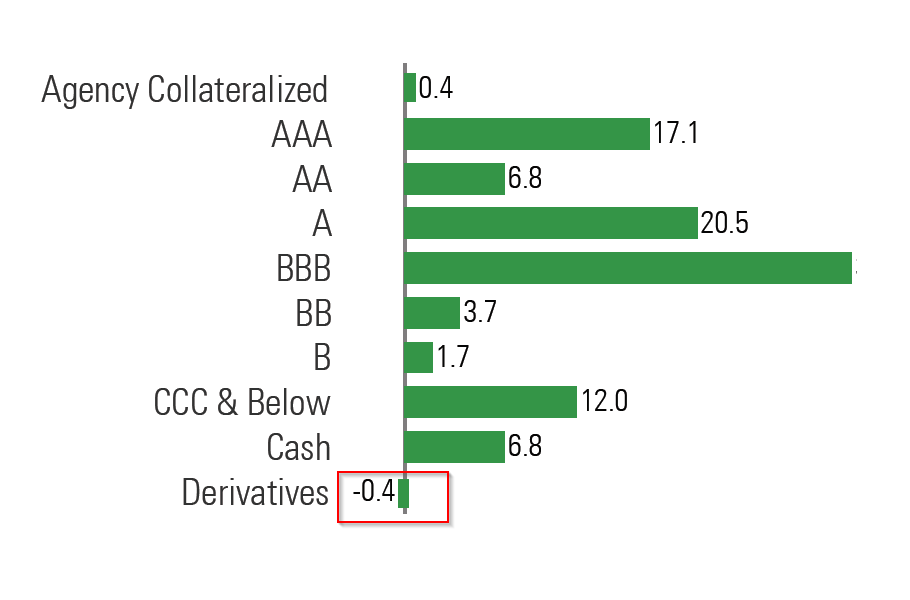
I think I understand the issue now, the constant line even if given to start from 0, it is little over the axis. This I think is a default qlik behaviour where the constant line is not exactly at 0. Is there any way we can keep the X-axis at 0 and make the labels go back if there are negative values.
Like this :
