Unlock a world of possibilities! Login now and discover the exclusive benefits awaiting you.
- Qlik Community
- :
- All Forums
- :
- Qlik NPrinting
- :
- Pixelperfect report with a gauge
- Subscribe to RSS Feed
- Mark Topic as New
- Mark Topic as Read
- Float this Topic for Current User
- Bookmark
- Subscribe
- Mute
- Printer Friendly Page
- Mark as New
- Bookmark
- Subscribe
- Mute
- Subscribe to RSS Feed
- Permalink
- Report Inappropriate Content
Pixelperfect report with a gauge
I created a Pixelperfect report. I want to show a gauge with the result percentage. I my gauge will display the correct the needle. I only see a scale with little lines but no numbers. How can I change the scale to numbers. Can I used fix values? I have a scale from 0 till 100%. I just want to see a scale like (0,20,40,60,80,100) or something similar.
How can I do this?
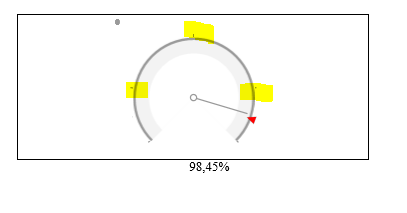
The number below is just a calculated field
Accepted Solutions
- Mark as New
- Bookmark
- Subscribe
- Mute
- Subscribe to RSS Feed
- Permalink
- Report Inappropriate Content
Hi Wouter,
This seems to be a bug in 17.x. I can reproduce it.
In my testing, if I copy the characters in the red box and paste it into Notepad I get the grading intervals.
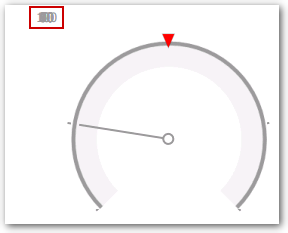
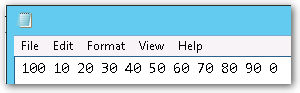
I will open a bug case internally. I suggest you open a case with Support if you want to be informed of progress.
Best regards,
Daniel.
- Mark as New
- Bookmark
- Subscribe
- Mute
- Subscribe to RSS Feed
- Permalink
- Report Inappropriate Content
Hello Wouter,
As per your requirement in the gauge chart changes, You can only change the Guage chart in the Qlik Application,
and same object you will be get in the Nprinting report because You are using here the same object as it is in qlik
application(i.e. Image object).
- Mark as New
- Bookmark
- Subscribe
- Mute
- Subscribe to RSS Feed
- Permalink
- Report Inappropriate Content
Hi Wouter,
This seems to be a bug in 17.x. I can reproduce it.
In my testing, if I copy the characters in the red box and paste it into Notepad I get the grading intervals.
I will open a bug case internally. I suggest you open a case with Support if you want to be informed of progress.
Best regards,
Daniel.
- Mark as New
- Bookmark
- Subscribe
- Mute
- Subscribe to RSS Feed
- Permalink
- Report Inappropriate Content
Thanks. I will stop to try further options. Now I know that I'm not the only one.
- Mark as New
- Bookmark
- Subscribe
- Mute
- Subscribe to RSS Feed
- Permalink
- Report Inappropriate Content
Exporting as jpg/png/excel give the correct result.