Unlock a world of possibilities! Login now and discover the exclusive benefits awaiting you.
- Qlik Community
- :
- All Forums
- :
- Qlik NPrinting
- :
- Totals for 3 different barcharts
- Subscribe to RSS Feed
- Mark Topic as New
- Mark Topic as Read
- Float this Topic for Current User
- Bookmark
- Subscribe
- Mute
- Printer Friendly Page
- Mark as New
- Bookmark
- Subscribe
- Mute
- Subscribe to RSS Feed
- Permalink
- Report Inappropriate Content
Totals for 3 different barcharts
Hello ,
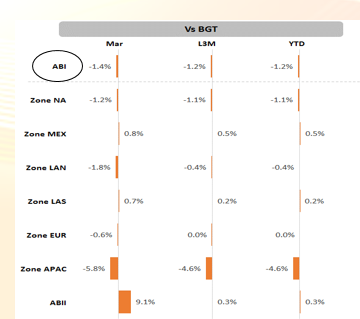
I have a requirement in my project where I need to compare sales vs budget for different zones on 3 different parameters viz : Month, last 3 months and year to date .
I am facing a problem when I use 3 horizontal bar charts in a container object for each parameter , I am unable to get the total value of all the zones , also if I select all zones the total should have ABI as label while if I choose individual zones , the zone name should be present in label , total in other cases .
Should I use straight table instead of using 3 bar charts ?
Can someone help me with this , attaching snapshot of the requirement .
- Tags:
- bar chart
Accepted Solutions
- Mark as New
- Bookmark
- Subscribe
- Mute
- Subscribe to RSS Feed
- Permalink
- Report Inappropriate Content
I used straight table with linear gauge and calculated dimension as a solution .
Will send a sample if someone wants .
- Mark as New
- Bookmark
- Subscribe
- Mute
- Subscribe to RSS Feed
- Permalink
- Report Inappropriate Content
Can someone please help me out , any suggestion is appreciated .
- Mark as New
- Bookmark
- Subscribe
- Mute
- Subscribe to RSS Feed
- Permalink
- Report Inappropriate Content
Shantanu,
Yes, is there any restriction to create the Straight table with those three expressions.
Try that way or send the sample application
- Mark as New
- Bookmark
- Subscribe
- Mute
- Subscribe to RSS Feed
- Permalink
- Report Inappropriate Content
Hello Anil ,
Thanks for the response , the issue with straight table is that I can't show values on the line gauge . One more issue is changing the total label based on the selection values :
if I select all zones the total should have ABI as label while if I choose individual zones , the zone name should be present in label , total in other cases .
I don't have a sample qvw readily available with me , please refer to the attached image .
Regards,
Shantanu
- Mark as New
- Bookmark
- Subscribe
- Mute
- Subscribe to RSS Feed
- Permalink
- Report Inappropriate Content
Can you please post the example
- Mark as New
- Bookmark
- Subscribe
- Mute
- Subscribe to RSS Feed
- Permalink
- Report Inappropriate Content
Attaching the snapshot .
I am not concerned about the formula/data values , just want a similar structure .
- Mark as New
- Bookmark
- Subscribe
- Mute
- Subscribe to RSS Feed
- Permalink
- Report Inappropriate Content
I used straight table with linear gauge and calculated dimension as a solution .
Will send a sample if someone wants .