Unlock a world of possibilities! Login now and discover the exclusive benefits awaiting you.
- Qlik Community
- :
- All Forums
- :
- Qlik NPrinting
- :
- nPrinting Excel Report Table Border
- Subscribe to RSS Feed
- Mark Topic as New
- Mark Topic as Read
- Float this Topic for Current User
- Bookmark
- Subscribe
- Mute
- Printer Friendly Page
- Mark as New
- Bookmark
- Subscribe
- Mute
- Subscribe to RSS Feed
- Permalink
- Report Inappropriate Content
nPrinting Excel Report Table Border
Hi All,
I am facing a problem in nPrinting excel report.
Data source is qlikview.
For generating the report in nPrinting, I added two tables in same sheet of an excel report.
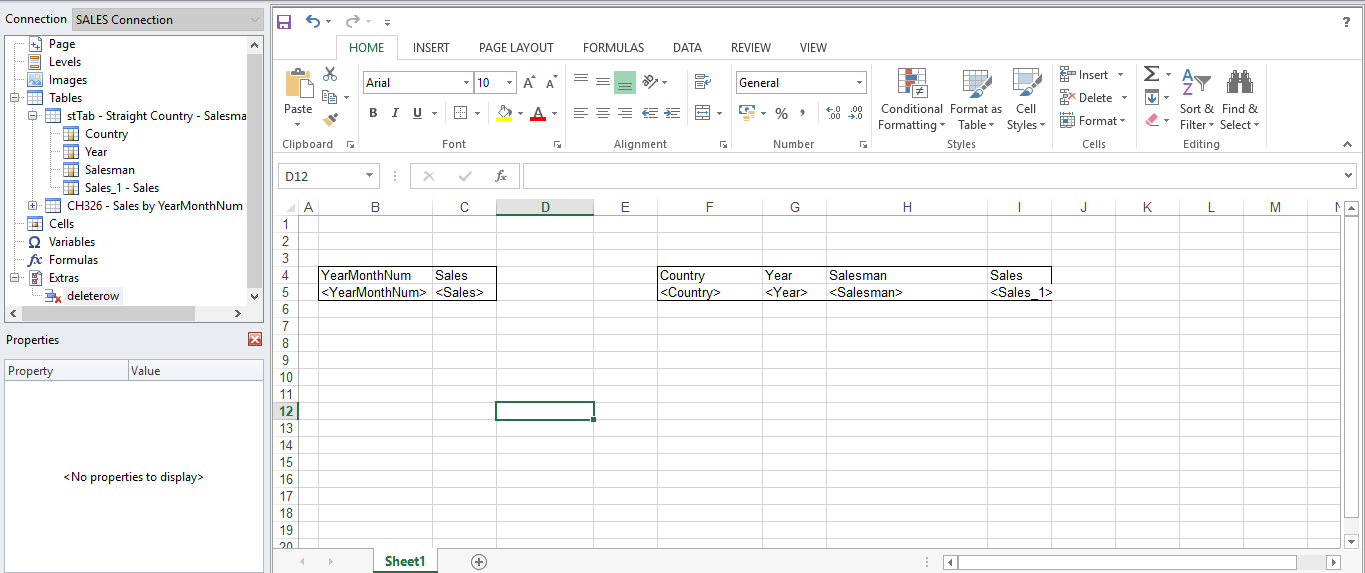
I have created the excel template as below:
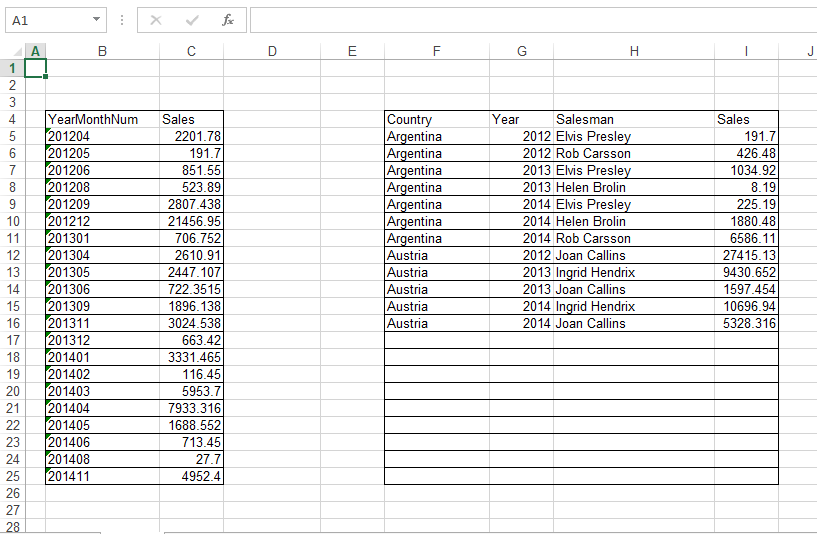
But the problem is when I generate the report, the output is coming as below:
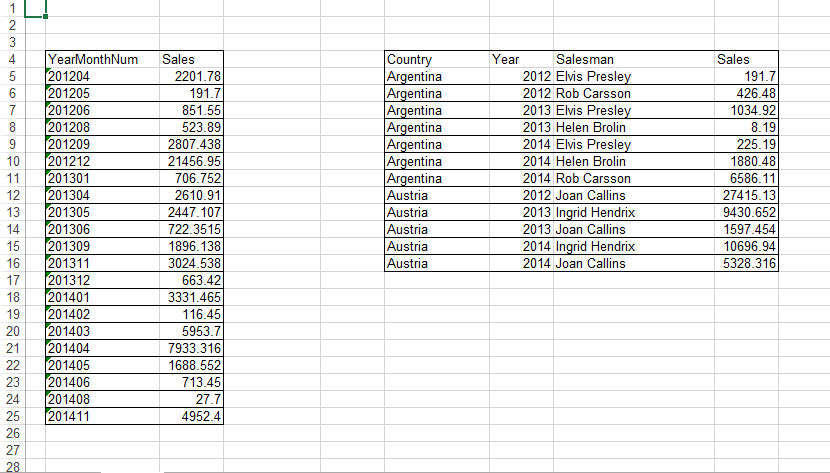
Whereas the desired output is as below:
Is there any possible solution for this..
--
Thanks,
SAMRAT
Accepted Solutions
- Mark as New
- Bookmark
- Subscribe
- Mute
- Subscribe to RSS Feed
- Permalink
- Report Inappropriate Content
sure there is - I am just not able to test it now and take screenshots but one or maybe two options should work:
- put extra row between header row and data row and make sure that extra row does not have border. Same applies to row below. details below
-
- Header is in row 3 and it has all borders
- row 4 has no borders and you can hide it - but having it without borders will mean that data populated in row 5 and downwards will not have borders
- add extra row (row 6) so the bottom border is not copied as data gets populated and remove it using <deleterow>
- in row 7 use top border to create a wrapping border around whole table

that is in the nutshell the concept i often use.
You may try to put <deleterow> also in row 4, however I am not sure if that will work then - test it
cheers
- Mark as New
- Bookmark
- Subscribe
- Mute
- Subscribe to RSS Feed
- Permalink
- Report Inappropriate Content
Nprinting works best vertically when it comes to adding data tables to an NPrinting excel report. It can be done to a certain extent but it is tricky
It's more effective to use image chart table object rather than table data objects if need a side by side representation.
If you must use tables, ideally place your tables vertically not horizontally (also as per the point made by @Lech_Miszkiewicz regarding expanded ranges). For more information about "expand range" visit this help page for details).
If you must use side by side tables, you can experiment with the expand range table property feature.
Kind regards.
- Mark as New
- Bookmark
- Subscribe
- Mute
- Subscribe to RSS Feed
- Permalink
- Report Inappropriate Content
as you probably noticed this is because you are creating new rows based on your template's first row. Since your first table on the left has more rows the formatting is carried across to the second table too for every created row in spreadsheet (not in this first table)!
I am not sure if you could use conditional border formatting for it? like if cell is empty then no formatting - i am not an excel guru?
I might have to test it further to give you correct answer. I am suspecting it can be achieved by using tables instead of ranges in excel.
regards
Lech
- Mark as New
- Bookmark
- Subscribe
- Mute
- Subscribe to RSS Feed
- Permalink
- Report Inappropriate Content
Hi @samrat_g @Lech_Miszkiewicz ,
Even I am facing the same issue. Is there any workaround to avoid this?
Regards,
Rohit Gharat
- Mark as New
- Bookmark
- Subscribe
- Mute
- Subscribe to RSS Feed
- Permalink
- Report Inappropriate Content
sure there is - I am just not able to test it now and take screenshots but one or maybe two options should work:
- put extra row between header row and data row and make sure that extra row does not have border. Same applies to row below. details below
-
- Header is in row 3 and it has all borders
- row 4 has no borders and you can hide it - but having it without borders will mean that data populated in row 5 and downwards will not have borders
- add extra row (row 6) so the bottom border is not copied as data gets populated and remove it using <deleterow>
- in row 7 use top border to create a wrapping border around whole table
that is in the nutshell the concept i often use.
You may try to put <deleterow> also in row 4, however I am not sure if that will work then - test it
cheers
- Mark as New
- Bookmark
- Subscribe
- Mute
- Subscribe to RSS Feed
- Permalink
- Report Inappropriate Content
to add to this - If you are trying to situation where you have 2 different tables side by side then the issue is more complex. In those scenarios you may choose to disable "Expand range". Any other option I would need to test - but cannot do it now unfortunatelly.
- Mark as New
- Bookmark
- Subscribe
- Mute
- Subscribe to RSS Feed
- Permalink
- Report Inappropriate Content
Nprinting works best vertically when it comes to adding data tables to an NPrinting excel report. It can be done to a certain extent but it is tricky
It's more effective to use image chart table object rather than table data objects if need a side by side representation.
If you must use tables, ideally place your tables vertically not horizontally (also as per the point made by @Lech_Miszkiewicz regarding expanded ranges). For more information about "expand range" visit this help page for details).
If you must use side by side tables, you can experiment with the expand range table property feature.
Kind regards.