Unlock a world of possibilities! Login now and discover the exclusive benefits awaiting you.
- Qlik Community
- :
- All Forums
- :
- Qlik NPrinting
- :
- Re: using a excel pie chart with nprinting
- Subscribe to RSS Feed
- Mark Topic as New
- Mark Topic as Read
- Float this Topic for Current User
- Bookmark
- Subscribe
- Mute
- Printer Friendly Page
- Mark as New
- Bookmark
- Subscribe
- Mute
- Subscribe to RSS Feed
- Permalink
- Report Inappropriate Content
using a excel pie chart with nprinting
Hi Guys
Im using NP17.3 with Qlik Sense.
I had pie charts coming through from Sense under levels nicely but one of the feedback from the client ws they didnt want the pie chart to flip from % to value when the value was 100%. Part of Sense being helpful but in reporting they want consitency or format.
So I've looked into replacing the image with a excel generated chart which ive done,
Result
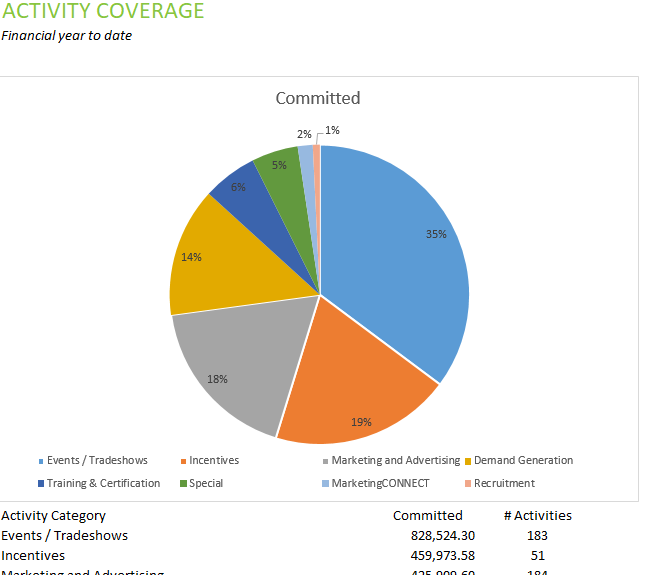
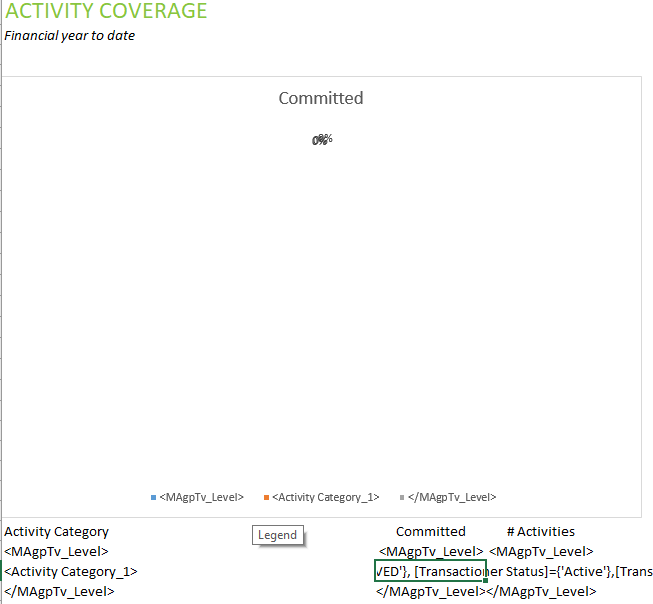
All nice a pretty but when I add the other levels in around it the pie chart doesn't generate as Id expect.

2 Issues I see. 1 the data source jumps a row. 2 it only applies to the first cut of the level. Result in screenshot in below post. What am I doing wrong when it comes to implementing the chart in a multi level sheet. It only seeems to work with one level and thats the table.
Regards
Andy
Accepted Solutions
- Mark as New
- Bookmark
- Subscribe
- Mute
- Subscribe to RSS Feed
- Permalink
- Report Inappropriate Content
Dear Andy,
Unfortunately at the moment you cannot insert a native Excel chart nested into a level due to the problems you reported. Instead you can use the Page node, so create a different Excel worksheet for each value of the field you inserted into the level.
If you want an output in PDF you could also evaluate to develop a PiaxelPerfect template.
I hope this helps.
Best Regards,
Ruggero
---------------------------------------------
When applicable please mark the appropriate replies as CORRECT. This will help community members and Qlik Employees know which discussions have already been addressed and have a possible known solution. Please mark threads with a LIKE if the provided solution is helpful to the problem, but does not necessarily solve the indicated problem. You can mark multiple threads with LIKEs if you feel additional info is useful to others.
- Mark as New
- Bookmark
- Subscribe
- Mute
- Subscribe to RSS Feed
- Permalink
- Report Inappropriate Content
the result not the postion of the selected data source.

Its using this source to generate the same pie chart at each level.
- Mark as New
- Bookmark
- Subscribe
- Mute
- Subscribe to RSS Feed
- Permalink
- Report Inappropriate Content
Dear Andy,
Unfortunately at the moment you cannot insert a native Excel chart nested into a level due to the problems you reported. Instead you can use the Page node, so create a different Excel worksheet for each value of the field you inserted into the level.
If you want an output in PDF you could also evaluate to develop a PiaxelPerfect template.
I hope this helps.
Best Regards,
Ruggero
---------------------------------------------
When applicable please mark the appropriate replies as CORRECT. This will help community members and Qlik Employees know which discussions have already been addressed and have a possible known solution. Please mark threads with a LIKE if the provided solution is helpful to the problem, but does not necessarily solve the indicated problem. You can mark multiple threads with LIKEs if you feel additional info is useful to others.
- Mark as New
- Bookmark
- Subscribe
- Mute
- Subscribe to RSS Feed
- Permalink
- Report Inappropriate Content
Thanks for your reply.
Is this an issue in 16 aswell? or just a feature not suppported in 17 yet.
- Mark as New
- Bookmark
- Subscribe
- Mute
- Subscribe to RSS Feed
- Permalink
- Report Inappropriate Content
Before answering you I tested both 17.4 and 16.6 and both do not support native Excel charts inside levels.
Best Regards,
Ruggero
---------------------------------------------
When applicable please mark the appropriate replies as CORRECT. This will help community members and Qlik Employees know which discussions have already been addressed and have a possible known solution. Please mark threads with a LIKE if the provided solution is helpful to the problem, but does not necessarily solve the indicated problem. You can mark multiple threads with LIKEs if you feel additional info is useful to others.
- Mark as New
- Bookmark
- Subscribe
- Mute
- Subscribe to RSS Feed
- Permalink
- Report Inappropriate Content
Thankyou for the comprehensive response even if its not what I wanted to here
Regards
Andy
- Mark as New
- Bookmark
- Subscribe
- Mute
- Subscribe to RSS Feed
- Permalink
- Report Inappropriate Content
Hi Ruggero
I guess this relates also to:
- pivot tables/charts
- tables (Excel Tables)
doesn't it?
cheers
Lech
- Mark as New
- Bookmark
- Subscribe
- Mute
- Subscribe to RSS Feed
- Permalink
- Report Inappropriate Content
Hi Lech,
I tested all to write a complete answer:
- Exel pivot tables and pivot charts don't work inside a level
- Excel tables work inside a Level
Cheers,
Ruggero
Best Regards,
Ruggero
---------------------------------------------
When applicable please mark the appropriate replies as CORRECT. This will help community members and Qlik Employees know which discussions have already been addressed and have a possible known solution. Please mark threads with a LIKE if the provided solution is helpful to the problem, but does not necessarily solve the indicated problem. You can mark multiple threads with LIKEs if you feel additional info is useful to others.