Unlock a world of possibilities! Login now and discover the exclusive benefits awaiting you.
- Qlik Community
- :
- Discover
- :
- Blogs
- :
- Product
- :
- Product Innovation
- :
- Qlik GeoAnalytics mapping capabilities are now par...
- Subscribe to RSS Feed
- Mark as New
- Mark as Read
- Bookmark
- Subscribe
- Printer Friendly Page
- Report Inappropriate Content
Since we launched Qlik GeoAnalytics about a year ago, there has been great interest among both Qlik Sense and QlikView users in adding mapping and geo-analysis capabilities to their Qlik environment. Now we are making it even easier. Starting with Qlik Sense April 2018, we updated the mapping capabilities within Qlik Sense to be based on Qlik GeoAnalytics technology.
This new map chart object makes it easy to add maps to your app. Location related names such as countries, counties, provinces, regions, cities, airports, and zip codes now utilize a dynamic location name lookup service to automatically define and visualize geo data.
This new capability is available to all Qlik Sense users, whether they are using Desktop, Enterprise or Cloud. Additional Qlik GeoAnalytics features such as multiple layers, layer control, zoom levels, labels, and multiple point symbols are also included. And if you have maps in your existing apps, they will be seamlessly migrated to the new map object.
Points and area layers are available in this initial release. Additional layers and more capabilities are planned for future releases. Note that all geo-analysis calculations, such as drive-times, travel areas, binning, clustering or intersections, still require a different license.
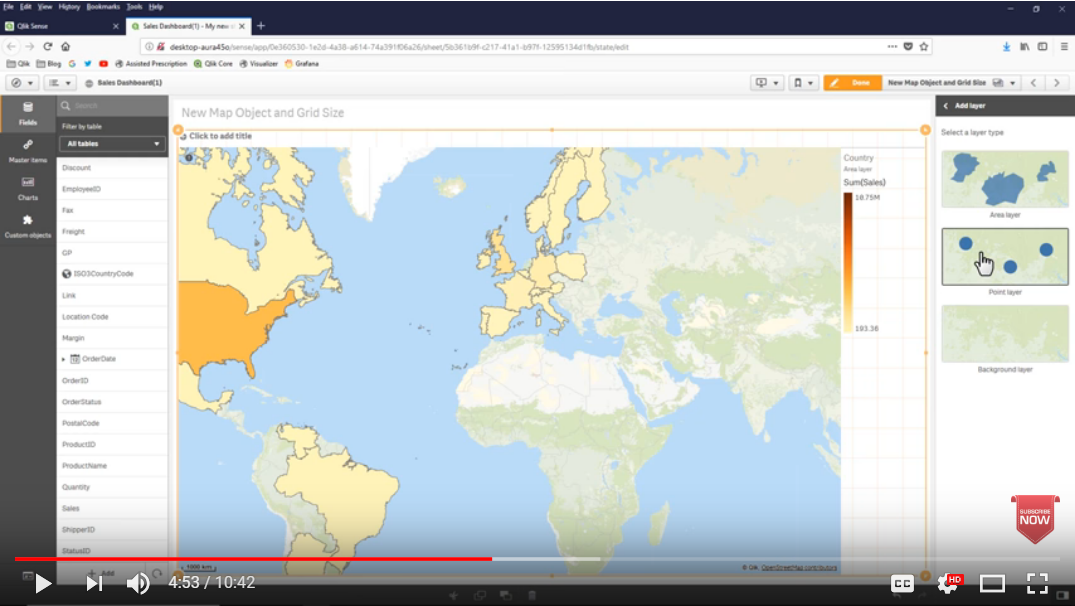
If you haven’t seen it yet, some of these new mapping capabilities can be found in the video - What’s New in Qlik Sense April 2018. Click on the image below to watch the video.
- « Previous
-
- 1
- 2
- Next »
You must be a registered user to add a comment. If you've already registered, sign in. Otherwise, register and sign in.
