Unlock a world of possibilities! Login now and discover the exclusive benefits awaiting you.
- Qlik Community
- :
- Forums
- :
- Forums by Product
- :
- Products (A-Z)
- :
- Qlik Sense
- :
- Documents
- :
- Digitizing floor plans for use in Qlik GeoAnalytic...
- Move Document
- Delete Document
- Subscribe to RSS Feed
- Mark as New
- Mark as Read
- Bookmark
- Subscribe
- Printer Friendly Page
- Report Inappropriate Content
Digitizing floor plans for use in Qlik GeoAnalytics (QGA)
- Move Document
- Delete Document and Replies
- Mark as New
- Bookmark
- Subscribe
- Mute
- Subscribe to RSS Feed
- Permalink
- Report Inappropriate Content
Digitizing floor plans for use in Qlik GeoAnalytics (QGA)
Apr 2, 2021 4:18:51 AM
Aug 1, 2018 8:06:23 AM
Update, the example app now have the drawing as a background.
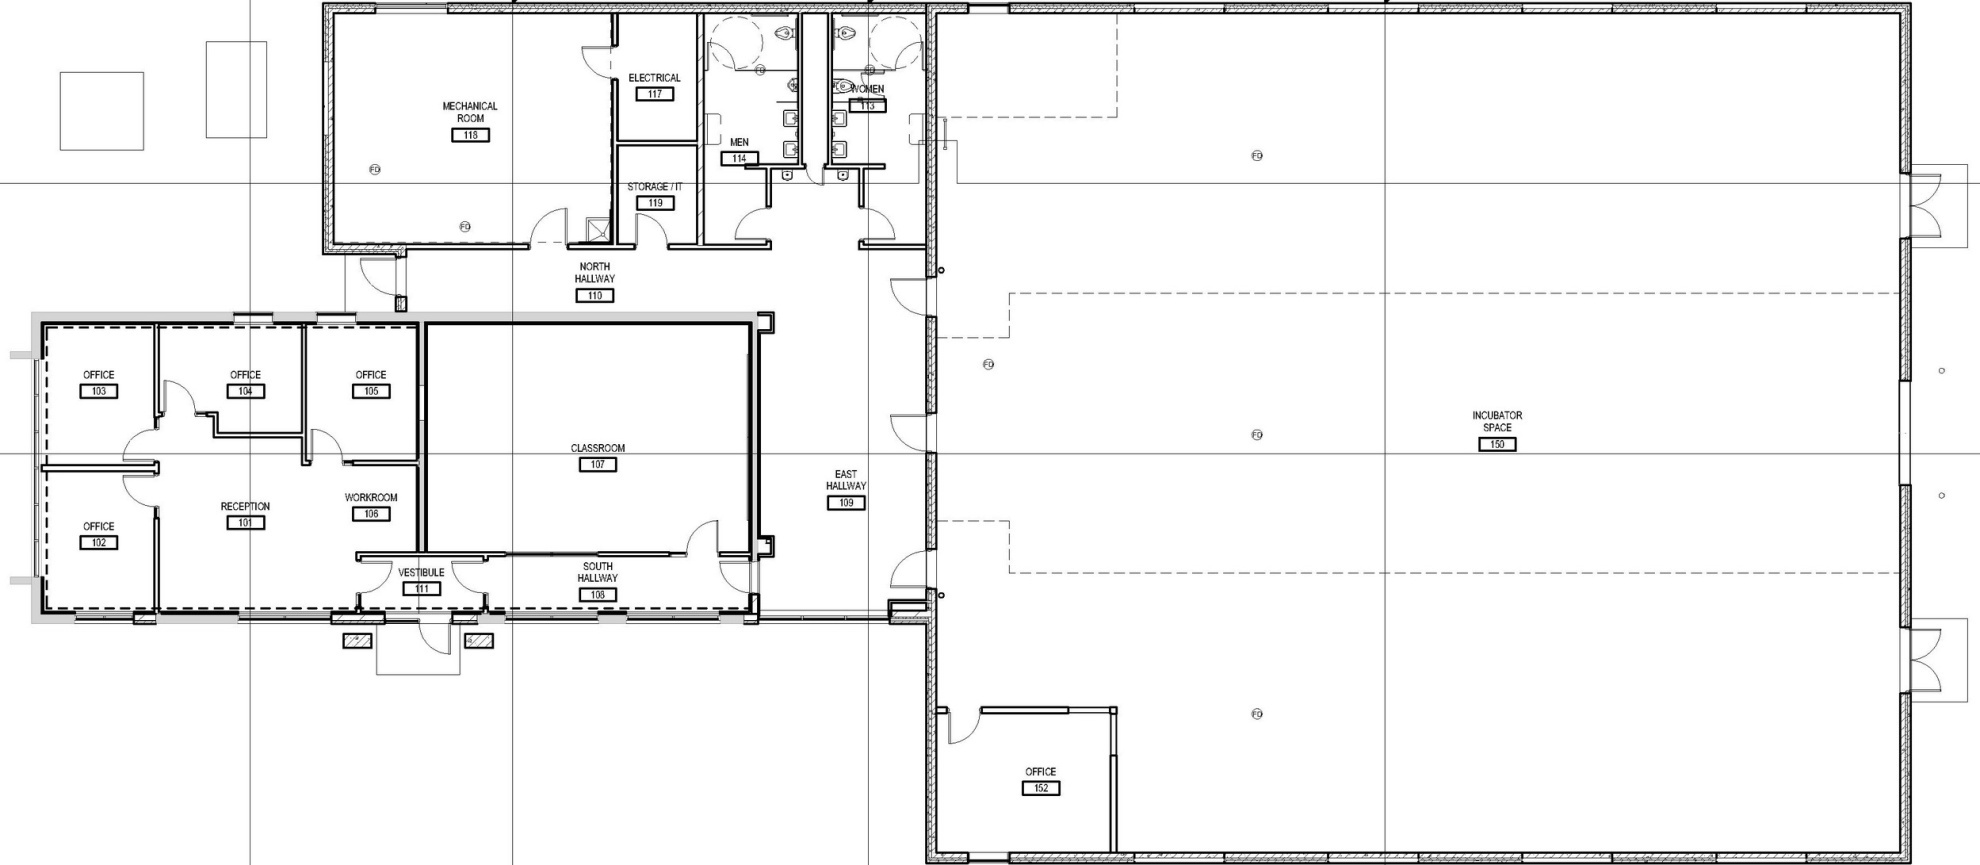
Floor plans and cad drawings can be useful, for instance in production dashboards, to visualize status and flows in a factory. However cad drawings are in many cases a mess to work with.
Here's a simple, pragmatic approach to digitize rather than import the actual drawing. The major issue with most CAD drawings is lack of structure, details without meaning and the objects on the right level are missing. It’s not the format or alignment that is the problem. In many cases it's better to use the drawing as a input to produce the polygons and information needed.
In this tutorial I use QGIS for digitizing and out put to a format that is easy to import to QGA. In this example the drawing is digitized in a local reference system, ie no alignment is made with the rest of the world.
Step-by-step guide
- Install QGA basic, Plus not needed if Dropbox et al is used.
- Install QGIS (https://www.qgis.org)
- Get a picture of the floor plan in an image format like PNG or JPG.
- Drag and drop the image to the layers panel of QGIS. Choose a meter based Coordinate Reference System, for instance EPSG:3857 is a good choice.
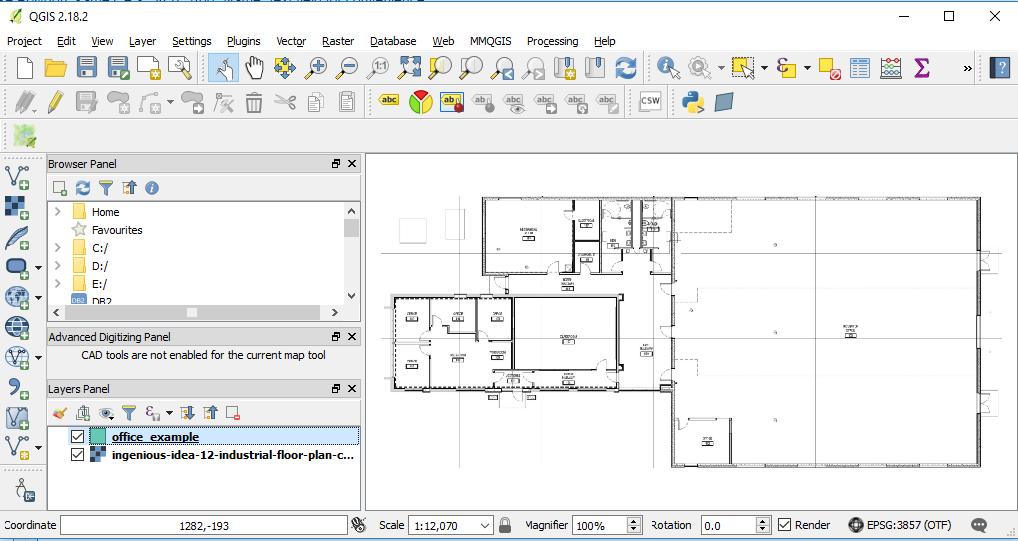
- Layer→ Create Layer→ New Shapefile Layer... Choose Polygon, same CRS, 3857. Add "Name" text field for convenience.

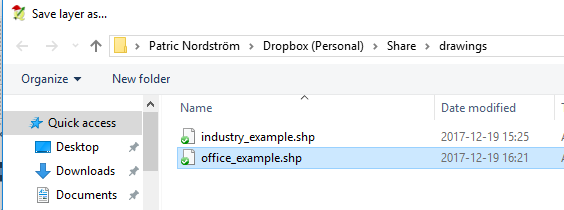
- Save layer in a folder. Preferable in dropbox folder.
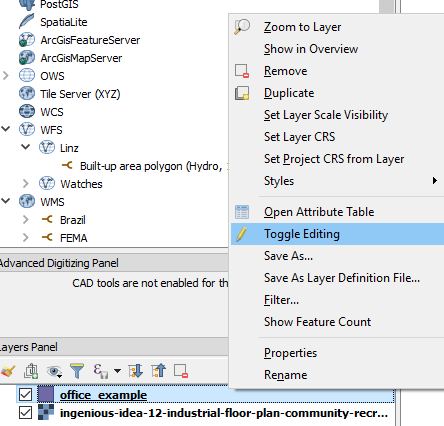
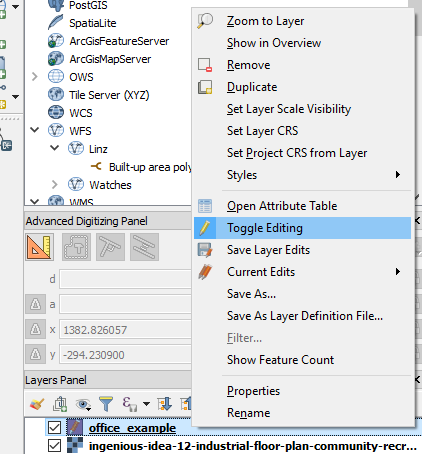
- Right click on the new polygon layer and "Toggle editing" to start editing.
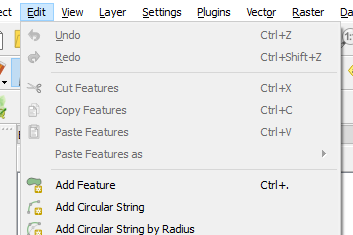
- Start adding features (Ctrl +)
- Click on the edges of the desired polygon, set id and name. Use node tool if fine tuning of edges is necessary.

- When done "Toggle editing"to save.
- Zip the shapefile to an archive and get the dropbox url. (replace www with dl to get direct link)
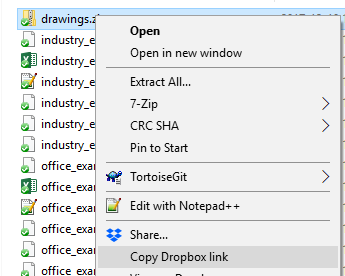
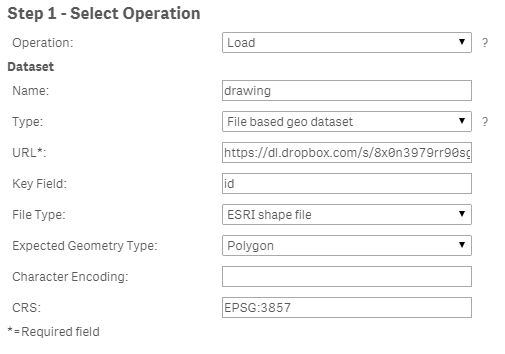
- Create a new Sense app and use the drop url in the Load operator of QGA connector. CRS: EPSG:3857. Note change url from 'www' to 'dl' for direct file access in dropbox.
Example app
The example app features sites and a drawing visible when one site is selected.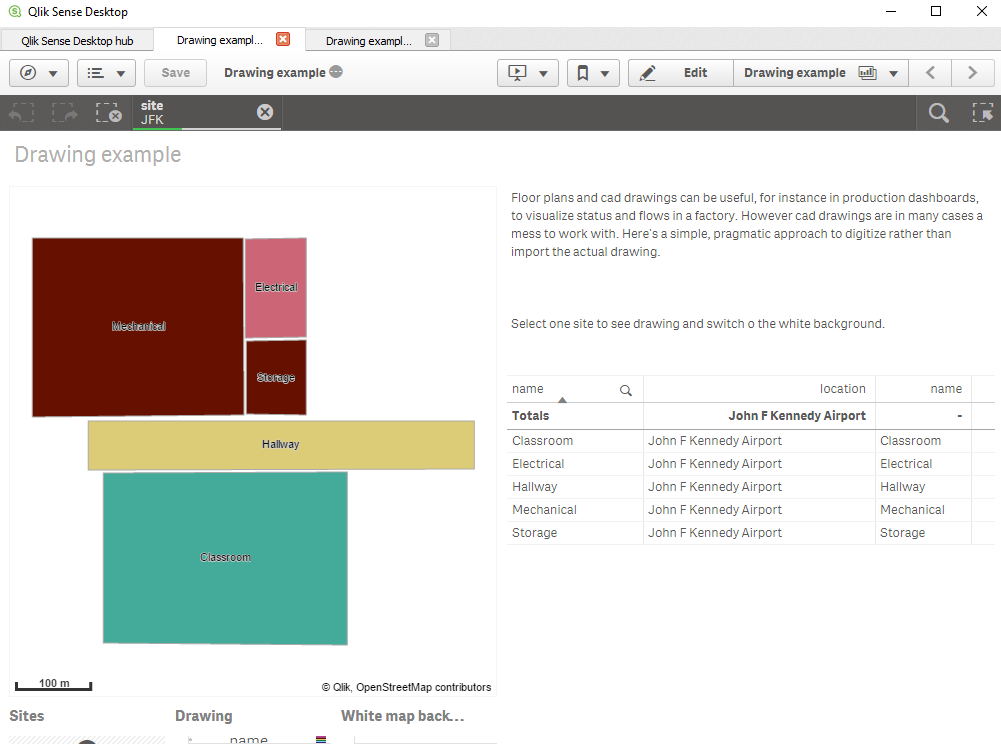
If you want to add and image background, here's how to scale and translate the image, in my example:

 Tip 1: get a white background use ='[[ [-180, -80], [-180, 80], [ 180, 80], [ 180, -80], [-180, -80] ]]' for location, set color to white and make the layer non selectable and not part of autozoom.
Tip 2, Use a bubble layer with coordinates for different sites, when one site is selected turn on drawing and the white background.
- Move Comment
- Delete Comment
- Mark as Read
- Mark as New
- Bookmark
- Permalink
- Report Inappropriate Content
This is a great way to leverage Geoanalytics !
Is there a way to get the original floor plan drawing as a background for this map ? This would allow to have other layers (such as points and density layers) directely on top of the drawing.
- Move Comment
- Delete Comment
- Mark as Read
- Mark as New
- Bookmark
- Permalink
- Report Inappropriate Content
Hey @Patric_Nordstrom,
is there any chance of putting drawings as background layer within the map (regarding @jfdierckx's question)?
Thanks Paul
- Move Comment
- Delete Comment
- Mark as Read
- Mark as New
- Bookmark
- Permalink
- Report Inappropriate Content
Hi,
Plain png image as background is on the roadmap for the native Qlik map chart for 2019.
Meanwhile check out Christof Schwarz work:
https://www.youtube.com/watch?v=4uWlmNm95n8
Thanks,
Patric
- Move Comment
- Delete Comment
- Mark as Read
- Mark as New
- Bookmark
- Permalink
- Report Inappropriate Content
This is among my favorite innovations at Qlik! Thanks @Patric_Nordstrom for writing out the process to make things like this possible: the Qlik Body Map app.
.png")
- Move Comment
- Delete Comment
- Mark as Read
- Mark as New
- Bookmark
- Permalink
- Report Inappropriate Content
Thanks @joe_warbington !
I made a custom guide for converting an image into map, check this post:
https://community.qlik.com/t5/Qlik-GeoAnalytics-Documents/Image-to-Map/ta-p/1552580
Thanks,
Patric
- Move Comment
- Delete Comment
- Mark as Read
- Mark as New
- Bookmark
- Permalink
- Report Inappropriate Content
Hi @Patric_Nordstrom ,
I was implementing the steps as mentioned by Christof Schwartz to map a floor pan in Qlik Sense. However I am facing an issue. I have done all the steps asked by you but my floor pan is not mapping the points correctly. Its able to map the Latitude co-ordinates correctly but the longitude coordinates are not being mapped. So essentially i am getting all the points in a straight vertical line. Could you help me out?
- Move Comment
- Delete Comment
- Mark as Read
- Mark as New
- Bookmark
- Permalink
- Report Inappropriate Content
Please check out Qlik Sense April 2019 ,the native mapchart now can have a plain image background, it's easier than the TMS approach unless the image is extremely big.
Thanks,
Patric
- Move Comment
- Delete Comment
- Mark as Read
- Mark as New
- Bookmark
- Permalink
- Report Inappropriate Content
Hi Patric, I am trying right now to insert an image layer in a map chart but I can't seem to succeed due to:
1) Chart size (looks like I need huge images to adapt to the chart and not to be displayed as small pins
2) Setting the upper left and lower right coordinates in order to fill the chart as best as possible with the image
and so on...
Is there any tutorial (except the help pages) that could point me to the required steps?
Thanks,
Radu
- Move Comment
- Delete Comment
- Mark as Read
- Mark as New
- Bookmark
- Permalink
- Report Inappropriate Content
Image as map background
- Move Comment
- Delete Comment
- Mark as Read
- Mark as New
- Bookmark
- Permalink
- Report Inappropriate Content
Image as map background