Unlock a world of possibilities! Login now and discover the exclusive benefits awaiting you.
- Qlik Community
- :
- Forums
- :
- Forums by Product
- :
- Products (A-Z)
- :
- Qlik Sense
- :
- Documents
- :
- Understanding the Master Calendar (video)
- Move Document
- Delete Document
- Subscribe to RSS Feed
- Mark as New
- Mark as Read
- Bookmark
- Subscribe
- Printer Friendly Page
- Report Inappropriate Content
Understanding the Master Calendar (video)
- Move Document
- Delete Document and Replies
- Mark as New
- Bookmark
- Subscribe
- Mute
- Subscribe to RSS Feed
- Permalink
- Report Inappropriate Content
Understanding the Master Calendar (video)
May 22, 2015 7:53:13 AM
May 22, 2015 7:53:13 AM
In this video I will introduce you to a concept known as the Master Calendar which can be used with both QlikView and Qlik Sense. A Master Calendar is simply a table that contains a time period and time attributes that you define, linked to your existing data.
If you are unable to analyze data by different time dimensions using your existing data set, or have noticed time gaps when create charts and visualizations - the Master Calendar will solve these problems.
Attached are samples below for your reference.
- .qvf for Qlik Sense Desktop - copy to C:\Users\<user profile>\Documents\Qlik\Sense\Apps
- .qvw for QlikView - open with QlikView Desktop
- master.txt - the script used to create the Master Calendar
Please be aware that the Master Calendar can be created a few different ways using Qlik scripting. It can also be made more efficient using specific methods and functions. The example in this post is used as a simple sample.
NOTE: To continue your learning experience, make sure to visit our Education web page at www.qlik.com/training
For details on our latest:
- Training
- Certifications
- Skills assessments
Regards,
Michael Tarallo
Qlik
- Move Comment
- Delete Comment
- Mark as Read
- Mark as New
- Bookmark
- Permalink
- Report Inappropriate Content
Great and useful video explaining master calendar. Excellent.
- Move Comment
- Delete Comment
- Mark as Read
- Mark as New
- Bookmark
- Permalink
- Report Inappropriate Content
Hi Michael,
nice video.
Here's another possible calendar script, maybe it's also helpful:
tabCalendar:
LOAD *,
Day(Date) as Day,
WeekDay(Date) as WeekDay,
Week(Date) as Week,
WeekName(Date) as WeekName,
Month(Date) as Month,
MonthName(Date) as MonthName,
Dual('Q'&Ceil(Month(Date)/3),Ceil(Month(Date)/3)) as Quarter,
QuarterName(Date) as QuarterName,
Year(Date) as Year,
WeekYear(Date) as WeekYear;
LOAD Date(MinDate+IterNo()-1) as Date
While MinDate+IterNo()-1 <= MaxDate;
LOAD Min(Date) as MinDate,
Max(Date) as MaxDate
Resident tabSourceOfDate;
regards
Marco
- Move Comment
- Delete Comment
- Mark as Read
- Mark as New
- Bookmark
- Permalink
- Report Inappropriate Content
Hi Michael
I tried using the above script to generate a master calendar. I am not sure what's going wrong with it. May be I am missing out something
I need to display tickets raised between a certain time period i.e between start and end dates.
I also need to display zero values for dates where there were no tickets raised
So i made changes to the script like below
QuartersMap:
MAPPING LOAD
rowno() as Month,
'Q' & Ceil (rowno()/3) as Quarter
AUTOGENERATE (12);
Temp:
Load
min([Release Start Date]) as minDate,
max([Release End Date]) as maxDate
Resident Release_dates;
Let varMinDate =
Num(Peek('minDate', 0, 'Temp'));
Let
varMaxDate = Num(Peek('maxDate', 0, 'Temp'));
DROP
Table Temp;
TempCalendar:
LOAD
$(varMinDate) + Iterno()-1 As Num,
Date($(varMinDate) + IterNo() - 1) as TempDate
AutoGenerate 1 While $(varMinDate) + IterNo() -1 <= $(varMaxDate);
MasterCalendar:
Load
TempDate AS [Ticket Raised Time (GMT)],
week(TempDate) As Week,
Year(TempDate) As Year,
Month(TempDate) As Month,
Day(TempDate) As Day,
ApplyMap('QuartersMap', month(TempDate), Null()) as Quarter,
Week(weekstart(TempDate)) & '-' & WeekYear(TempDate) as WeekYear,
WeekDay(TempDate) as WeekDay
Resident TempCalendar
Order By TempDate ASC;
Drop Table TempCalendar;
- Move Comment
- Delete Comment
- Mark as Read
- Mark as New
- Bookmark
- Permalink
- Report Inappropriate Content
Hi Sanjyot - can you please post this question in the main forum New to Qlik Sense so others can see it and possibly help? I am not able to respond at the moment and did not want you to wait longer than you have to.
Thanks
Mike
- Move Comment
- Delete Comment
- Mark as Read
- Mark as New
- Bookmark
- Permalink
- Report Inappropriate Content
Hi Michael
I have pasted it in the forum . Still awaiting a response from an expert on it.
- Move Comment
- Delete Comment
- Mark as Read
- Mark as New
- Bookmark
- Permalink
- Report Inappropriate Content
Hi Michael,
I have one question for you. my table has multiple rows for each date.
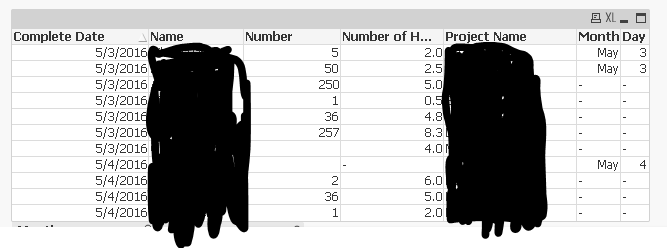
and when I use the master calendar and when the tables are automatically connected by [Complete Date], not all of the rows are picking up the Master Calendar data. actually more rows are missing the fields from the Master Calendar. How do I fix this problem?
- Move Comment
- Delete Comment
- Mark as Read
- Mark as New
- Bookmark
- Permalink
- Report Inappropriate Content
Hi David,
Can you open this discussion in the main forum so we can get more eyes on it? Also provide a sample if you wish. I attempted to duplicate this behavior and I am not seeing this. Please reference me @michael_tarallo and select my trigram mto in the new discussion so I can reply and attach the sample app I created for you. This interface (comment in video) does not let me attach file.
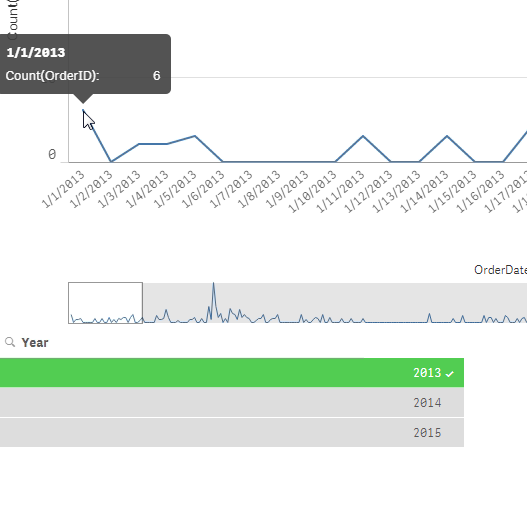
6 orders on Jan 1 2013 - filtering in Excel

6 orders on Jan 1 2013 - in Qlik Sense.
- Move Comment
- Delete Comment
- Mark as Read
- Mark as New
- Bookmark
- Permalink
- Report Inappropriate Content
Hi Michael,
Thank you for putting your thought into this.
I just figured out that the reason that this did not concatenate properly was because their format was different.
One had YYYYMMDD HHMMSS and the other one was YYYYMMDD. so I aligned their format and it is working fine now.
Thank you again for your great tutorial video! 
- Move Comment
- Delete Comment
- Mark as Read
- Mark as New
- Bookmark
- Permalink
- Report Inappropriate Content
Nice - great to hear 🙂
- Move Comment
- Delete Comment
- Mark as Read
- Mark as New
- Bookmark
- Permalink
- Report Inappropriate Content
Hi Michael,
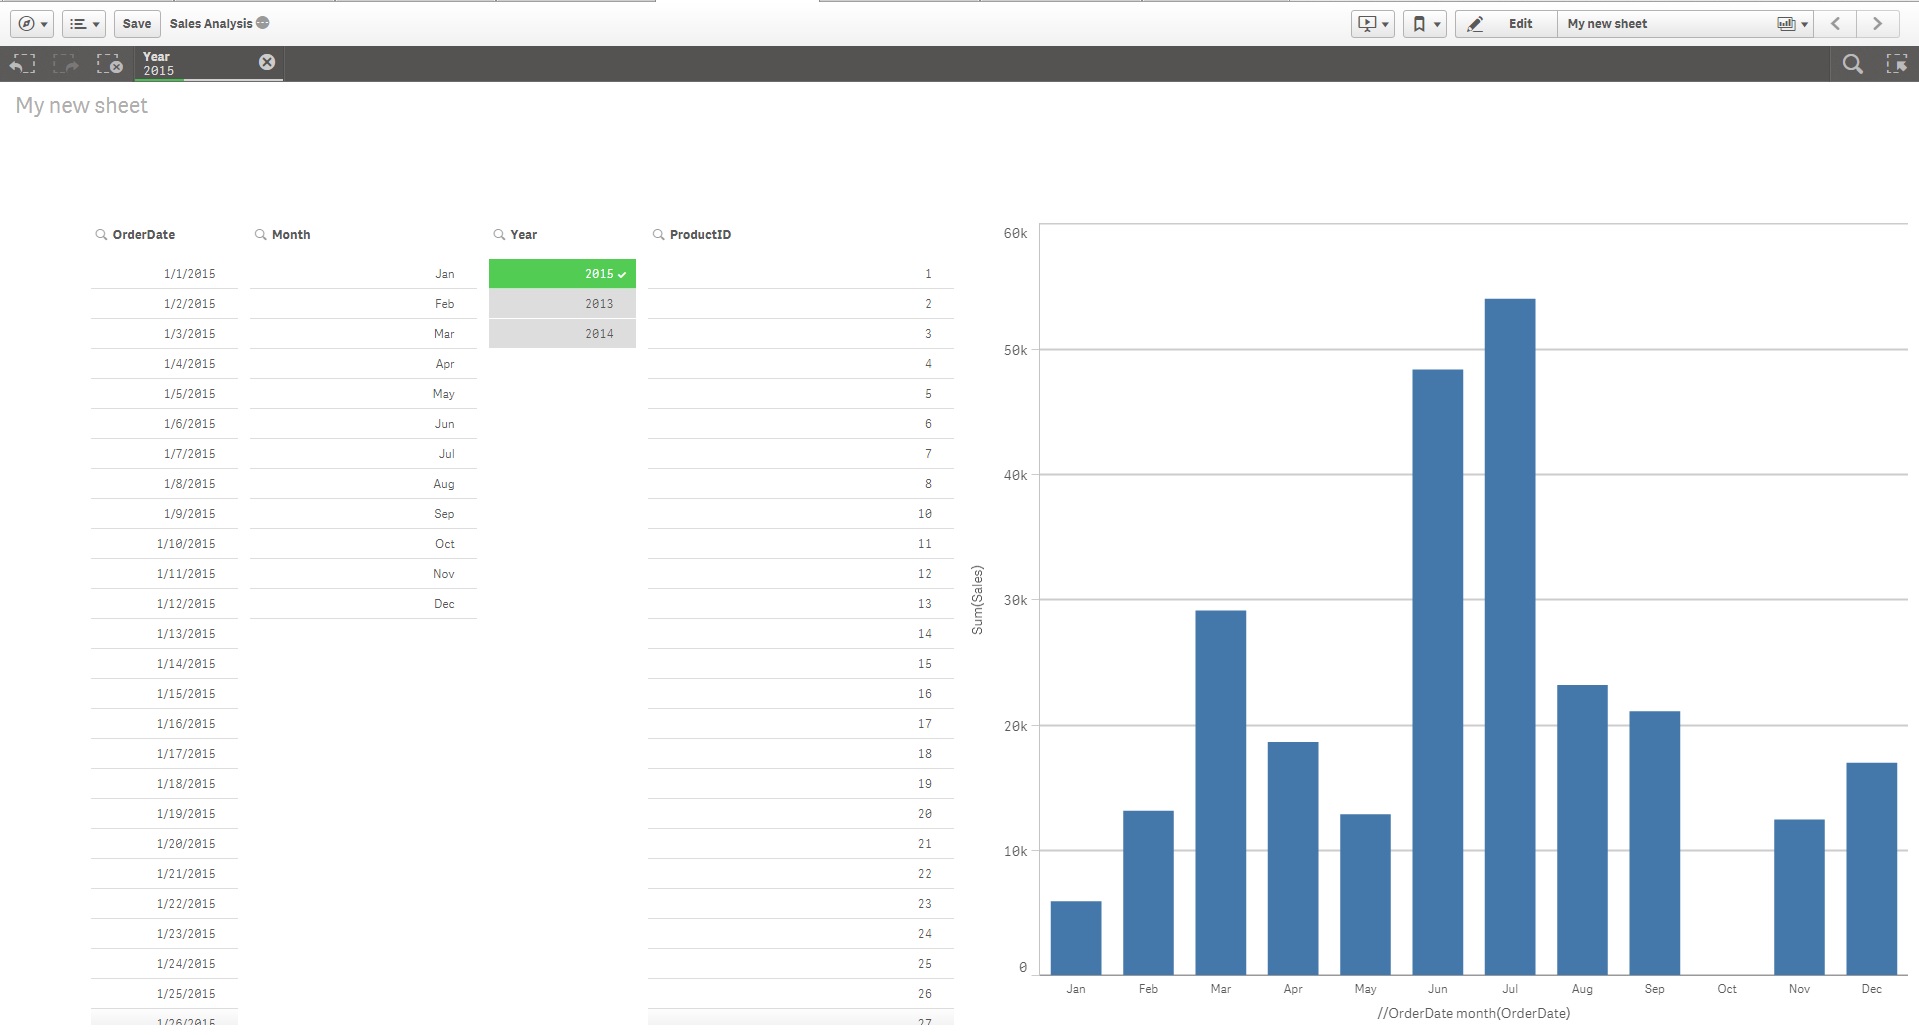
Thanks for the post. Its very useful ! Quick qlik question, I'm trying to apply that concept in one of my dashboards but failing to find the right way. I have tried to build on top of your dashboard but i observed the same behavior. I have notice that if you pull the your PRODUCT_ID into the dashboard as a filter the calendar doesn't really keeps doing what its suppose to (fill gaps with the empty date) when you filter it by product.Instead, it only plots the days that contains data, which is exactly what the master calendar tries to avoid. Would you be so kind to share some wisdom and save me from insanity please ?
Nothing selected (oct showing blank [ GREAT ]);
Product_ID 15 selected (Gaps back into play [NO BUENO]);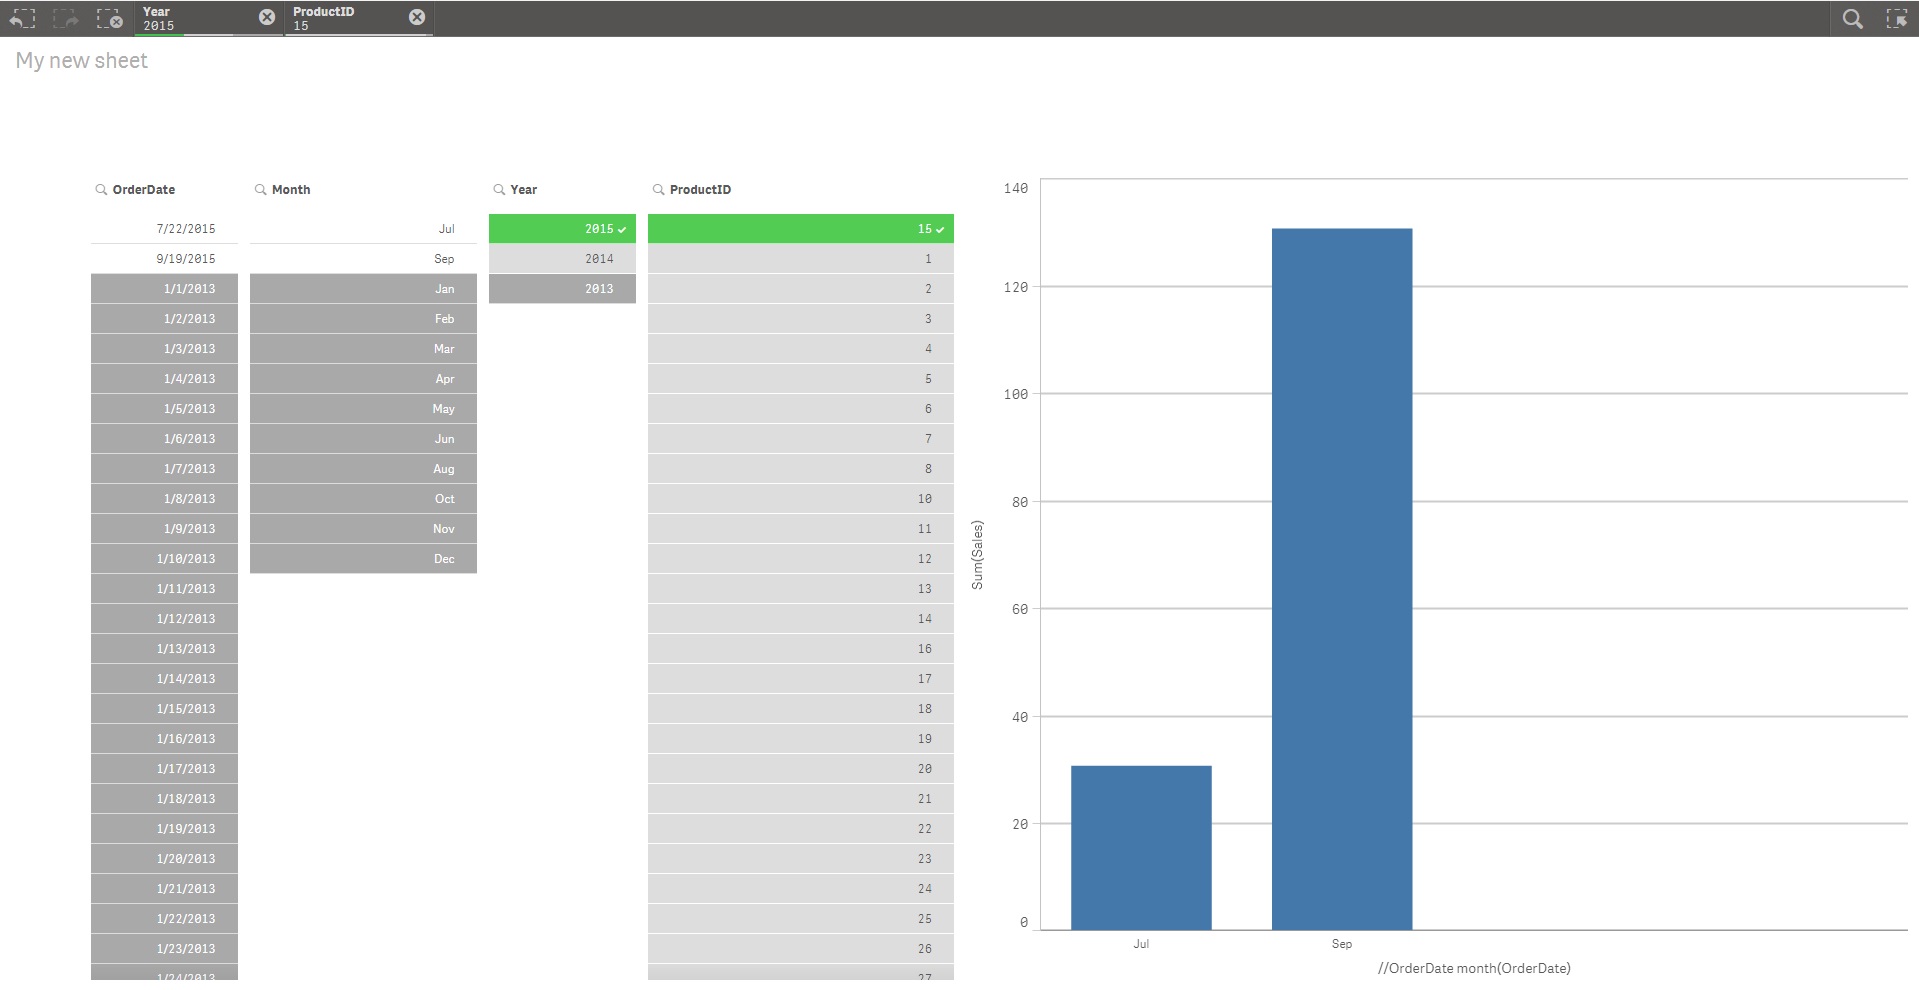
Thank you in advance
Antonio