Unlock a world of possibilities! Login now and discover the exclusive benefits awaiting you.
- Qlik Community
- :
- All Forums
- :
- Integration, Extension & APIs
- :
- Re: Qliksense: Timeline Extension: Values not gett...
- Subscribe to RSS Feed
- Mark Topic as New
- Mark Topic as Read
- Float this Topic for Current User
- Bookmark
- Subscribe
- Mute
- Printer Friendly Page
- Mark as New
- Bookmark
- Subscribe
- Mute
- Subscribe to RSS Feed
- Permalink
- Report Inappropriate Content
Qliksense: Timeline Extension: Values not getting displayed in ascending order and in separate lines.
I downloaded the Timeline extension(similar to Gantt Chart) as well as QVF file from https://github.com/ralfbecher/QlikSense_Extension_Timeline (attached are the files). I have done some modification in the downloaded Timeline file and the updated file is attached with the name TimelineO.qvf. The changes which were made are:
- 1) Added 6 more tasks and now there are 9 tasks in total for 3 groups.
- 2) Removed Events, Points from the previous Timeline extension file to easily understand the data for the extension.
I loaded the updated file and these are the issues which I am facing in Qliksense.
The first issue which I am facing is that the tasks are not coming line by line i.e. Task 1 should come in first line and Task 4 should come in second line. The Task should be displayed in separate lines.
Grp 1 | Task 1 |
|
|
| Task 4 |
| |
|
| Task 7 |
The Second issue which I am facing is that the task should be displayed in ascending order. It should be displayed as mentioned below:
Grp 3 | Task 3 |
|
|
| Task 6 |
| |
|
| Task 9 |
This is really important for my project as the provided Gantt chart is not much of use for me. Please suggest.
- « Previous Replies
-
- 1
- 2
- Next Replies »
- Mark as New
- Bookmark
- Subscribe
- Mute
- Subscribe to RSS Feed
- Permalink
- Report Inappropriate Content
Hi Ralf,
I am trying to add two more dimensions in the definition object but it is not coming. Actually you can get similar Google Timeline extension from Google Developer and this extension has taken reference from there only.
I am currently working on jsfiddle so that I can debug the code and it is throwing the error 'Cannot show more than 3-4 columns'.
I need to add two more dimension in the JS. Can you please help me out.
Attached are the snapshots from JSfiddle and the link so that you can directly open it.
https://jsfiddle.net/px00gepy/3/
It will work perfectly when you have 3-4 columns/dimensions.
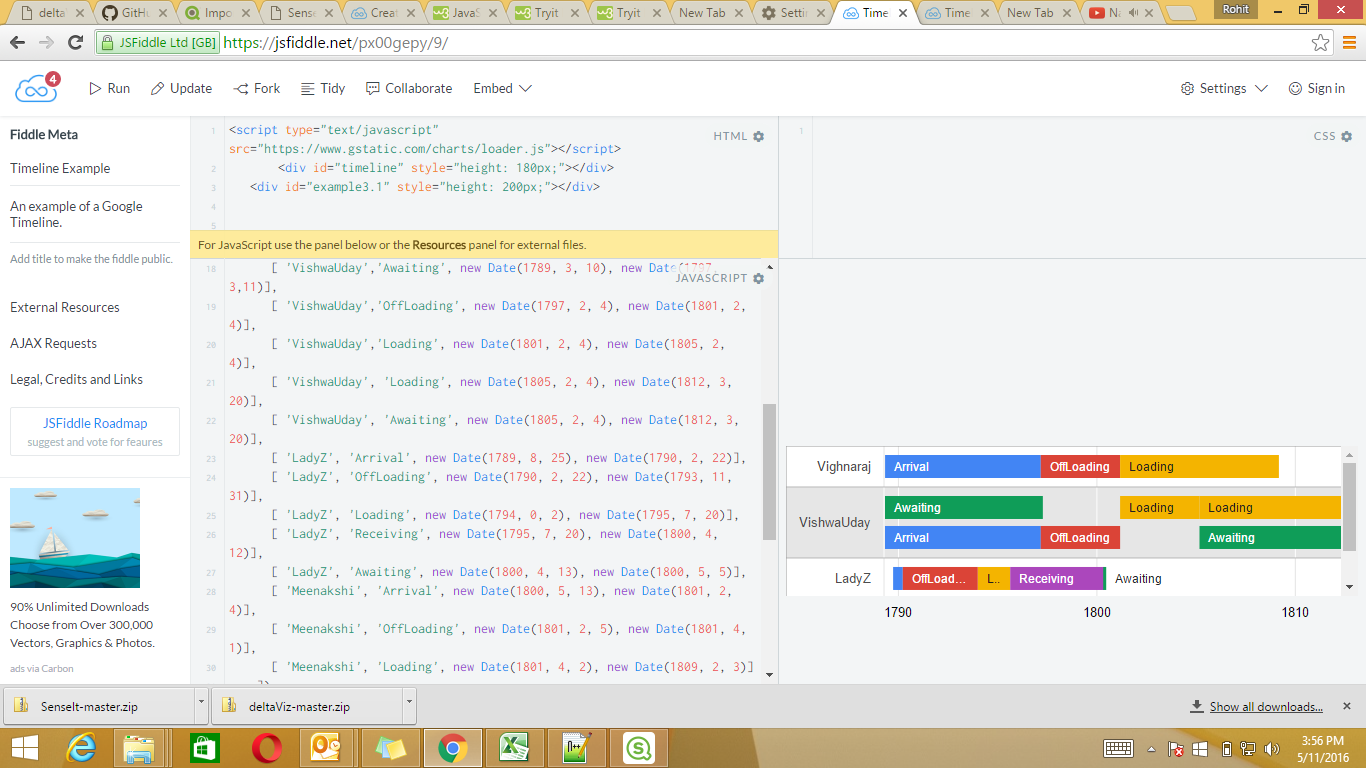
I add the fifth column/dimension and below is the error which is getting displayed.
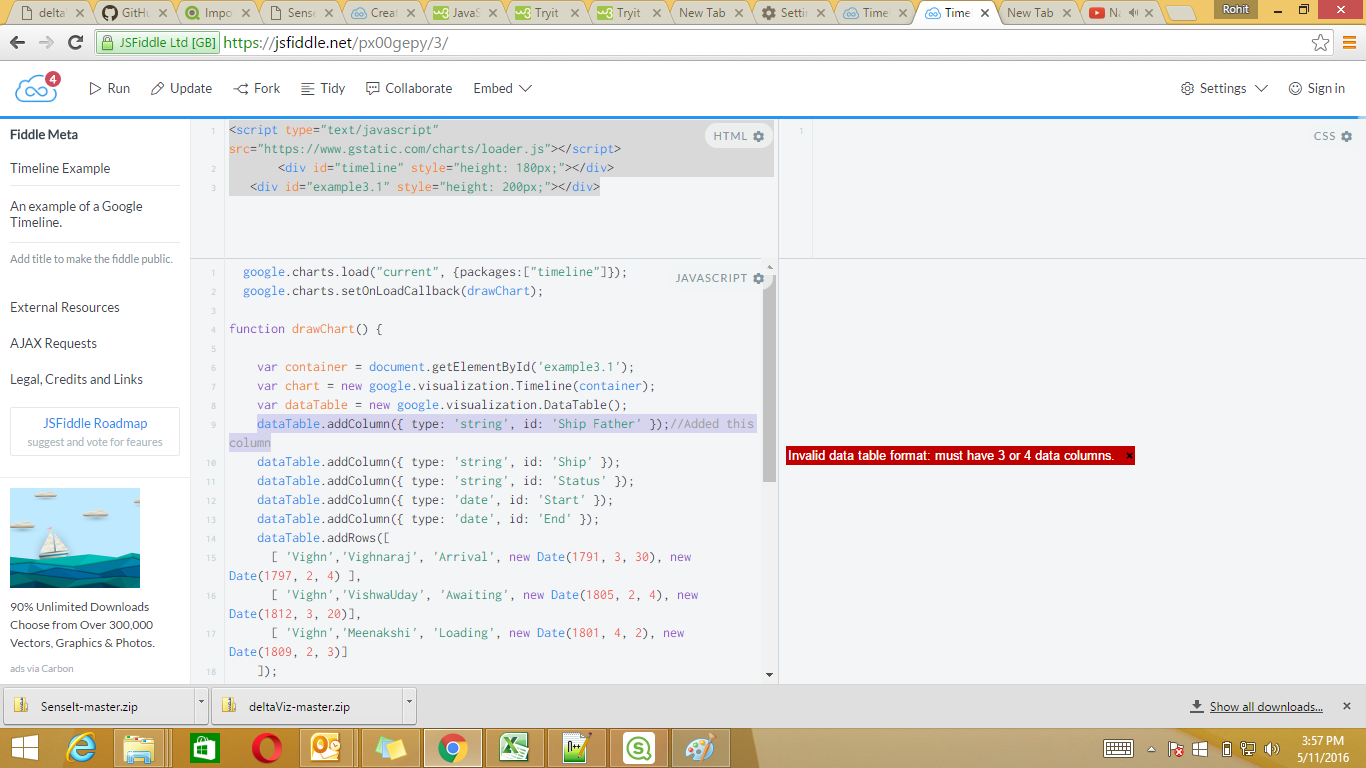
Please help me out in this.
reddys310- Hi I had a chat with you in Linkedin- Rohit Parimal. Can you also look into this also.
Regards
Rohit Parimal
- Mark as New
- Bookmark
- Subscribe
- Mute
- Subscribe to RSS Feed
- Permalink
- Report Inappropriate Content
Hi Manoj,
Can I ask you how do you make the google timeline extension work? I have downloaded from: GitHub - kaihj/qlik-sense-timeline: Qlik Sense Timeline Chart
However, I don't manage to make it work. It appears in Qlik - Extensions but says visualisation invalid...
Any idea what I might be doing wrong? Do I need to do something extra?
Ralf, In your extension for the timeline, which I really like, I tried to sort by event ID, but looks like the extension ignores completely the sorting part. Am I right? - I mean, that's the reason why I want to try the other extension,
Cheers,
Fabiola
- Mark as New
- Bookmark
- Subscribe
- Mute
- Subscribe to RSS Feed
- Permalink
- Report Inappropriate Content
Hi,
how is that you were able to change the color of the timeline extension, is this google time line which was mentioned by you in the earlier post, how is that possible, could you please help me achieve it.
were you able to achieve this timeline based on the data format that you have or modified or did some ETL to the data to get a standard data for the timeline use, Please help me out I need this urgent.
Kind Regards,
Anand.
- Mark as New
- Bookmark
- Subscribe
- Mute
- Subscribe to RSS Feed
- Permalink
- Report Inappropriate Content
Hi
How to change the color from green to custom color, is there a possibility, If so can you please help me where is that I can change the color.
Kind REgards,
Anand.
- Mark as New
- Bookmark
- Subscribe
- Mute
- Subscribe to RSS Feed
- Permalink
- Report Inappropriate Content
Did anyone ever figure out how to change the color from only being green? I really like the chart, but would be a lot better if there was different colors per category.
- Mark as New
- Bookmark
- Subscribe
- Mute
- Subscribe to RSS Feed
- Permalink
- Report Inappropriate Content
Hi Rohit,
If possible, could you please share where you found the google timeline extension and how you got the color coding to work? It would be a major help.
Thx,
Ben
- Mark as New
- Bookmark
- Subscribe
- Mute
- Subscribe to RSS Feed
- Permalink
- Report Inappropriate Content
Hi - Can you tell me how you changed the colors in the JS please ?
- Mark as New
- Bookmark
- Subscribe
- Mute
- Subscribe to RSS Feed
- Permalink
- Report Inappropriate Content
Does anyone know how/where to setup customized colors for the individual activities in Google Timeline Extenstion?
- Mark as New
- Bookmark
- Subscribe
- Mute
- Subscribe to RSS Feed
- Permalink
- Report Inappropriate Content
Hi All!
We're planning the Vizlib Gantt, including all of the customization features you'd want in a timeline object. If you are interested, please navigate to this link. To receive updates, you need to be logged in and click on the "Follow" button 😀
https://community.vizlib.com/support/discussions/topics/35000011567
- « Previous Replies
-
- 1
- 2
- Next Replies »