Unlock a world of possibilities! Login now and discover the exclusive benefits awaiting you.
- Qlik Community
- :
- All Forums
- :
- QlikView Administration
- :
- Re: Expression Pivot table
- Subscribe to RSS Feed
- Mark Topic as New
- Mark Topic as Read
- Float this Topic for Current User
- Bookmark
- Subscribe
- Mute
- Printer Friendly Page
- Mark as New
- Bookmark
- Subscribe
- Mute
- Subscribe to RSS Feed
- Permalink
- Report Inappropriate Content
Expression Pivot table
Hi,
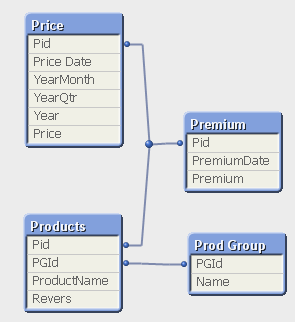
I have data schema:

I want to do this pivot table:

But I can't implement formula:
AVG(
for each Product
if(Revers = 1)
{
((Last Price in Data range (Year, quarter, month) + Sum Premium in Data range)/(First Price in Data range + Sum Premium Prior Data range)) - 1
}
else
{
1-((Last Price in Data range (Year, quarter, month) + Sum Premium in Data range)/(First Price in Data range))
}
Unfortunately I can not understand how to group the data in Expression and how to work with the pivot table dimensions.
Thanks so much
- Mark as New
- Bookmark
- Subscribe
- Mute
- Subscribe to RSS Feed
- Permalink
- Report Inappropriate Content
Can someone please help me with this task?
- Mark as New
- Bookmark
- Subscribe
- Mute
- Subscribe to RSS Feed
- Permalink
- Report Inappropriate Content
Hello,
your formula is not possible in a expresion.
You must create a set analysis as 'sum({$<PGId={"1"}>}Premium)'
In {$< you put fields with condition>}.
I join file with a example qvw and set analysis explication.
Sorry for my english.
Julien
- Mark as New
- Bookmark
- Subscribe
- Mute
- Subscribe to RSS Feed
- Permalink
- Report Inappropriate Content
hi you want average of what??? premium
- Mark as New
- Bookmark
- Subscribe
- Mute
- Subscribe to RSS Feed
- Permalink
- Report Inappropriate Content
Not premium. Average for value list, where value is:
for each product in Product group:
If Reverce = 1
((Last Price for product in date range + Sum Premium for product in date range ) / (First Price for product in date range + Sum Premium for product before date range)) - 1
Else
1 - ((Last Price for product in date range + Sum Premium for product in date range ) / (First Price for product in date range))
- Mark as New
- Bookmark
- Subscribe
- Mute
- Subscribe to RSS Feed
- Permalink
- Report Inappropriate Content
Please find the attachment for the solution !
- Mark as New
- Bookmark
- Subscribe
- Mute
- Subscribe to RSS Feed
- Permalink
- Report Inappropriate Content
I want see statistics in pivot table for each year, quarter, month (2004 (Q1, Q2, Q3, Q4), 2005, 2006, 2007). Date range in formula is a dimension in table.
This expression calculates the value directly in the whole interval of dates
- Mark as New
- Bookmark
- Subscribe
- Mute
- Subscribe to RSS Feed
- Permalink
- Report Inappropriate Content
I think function FirstSortedValue([Price Date],[Price Date]) in expression without taking into account the dimension
- Mark as New
- Bookmark
- Subscribe
- Mute
- Subscribe to RSS Feed
- Permalink
- Report Inappropriate Content
Your data is like that only that's why its showing like that
- Mark as New
- Bookmark
- Subscribe
- Mute
- Subscribe to RSS Feed
- Permalink
- Report Inappropriate Content
Ok. Maybe you know how can I change the data to solve the problem?