Unlock a world of possibilities! Login now and discover the exclusive benefits awaiting you.
- Qlik Community
- :
- All Forums
- :
- QlikView Administration
- :
- Show all period even there's no data in fact table
- Subscribe to RSS Feed
- Mark Topic as New
- Mark Topic as Read
- Float this Topic for Current User
- Bookmark
- Subscribe
- Mute
- Printer Friendly Page
- Mark as New
- Bookmark
- Subscribe
- Mute
- Subscribe to RSS Feed
- Permalink
- Report Inappropriate Content
Show all period even there's no data in fact table
Hi all,
I've got an issues when displaying a table or graph with time dimension the data granularity limited to month.
Data model
I got two tables one is fact another is time dimension let's call them FACT and TIME
In FACT there're 3 fields
YYYYMM PRODUCT AMOUNT
201701 A 1000
201701 B 1000
In TIME there're 2 fields
YYYYMM DIM_YYYYMM
201701 201701
201702 201702
201703 201703
201704 201704
201705 201705
201706 201706
In Set Analysis:
I create a table dimension take DIM_YYYYMM,Set Analysis I wrote SUM({<PRODUCT = {'A'}>}AMOUNT) the result will
only display:
DIM_YYYYMM SUM OF AMOUNT
201701 1000
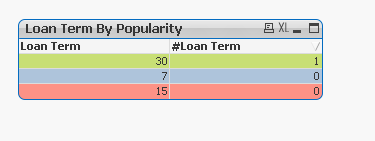
But I what I want is to display:
DIM_YYYYMM SUM OF AMOUNT
201701 1000
201702 0
201703 0
201704 0
201705 0
201706 0
Is there any good solution to solve the issue?
Thanks in advance.
Jiawen.
- Tags:
- qlikview_deployment
Accepted Solutions
- Mark as New
- Bookmark
- Subscribe
- Mute
- Subscribe to RSS Feed
- Permalink
- Report Inappropriate Content
- Mark as New
- Bookmark
- Subscribe
- Mute
- Subscribe to RSS Feed
- Permalink
- Report Inappropriate Content
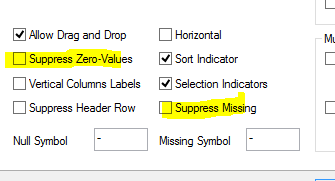
in the presentation tab un-check suppress zero values.
- Mark as New
- Bookmark
- Subscribe
- Mute
- Subscribe to RSS Feed
- Permalink
- Report Inappropriate Content
already unchecked
- Mark as New
- Bookmark
- Subscribe
- Mute
- Subscribe to RSS Feed
- Permalink
- Report Inappropriate Content
working for me buddy.
- Mark as New
- Bookmark
- Subscribe
- Mute
- Subscribe to RSS Feed
- Permalink
- Report Inappropriate Content
Try this,
SUM({<PRODUCT = {'A'},DIM_YYYYMM={"<=$(=max(DIM_YYYYMM)"}>}AMOUNT)
- Mark as New
- Bookmark
- Subscribe
- Mute
- Subscribe to RSS Feed
- Permalink
- Report Inappropriate Content
not work
- Mark as New
- Bookmark
- Subscribe
- Mute
- Subscribe to RSS Feed
- Permalink
- Report Inappropriate Content
Thanks I checked show all values under dimension tab then it works