Unlock a world of possibilities! Login now and discover the exclusive benefits awaiting you.
- Qlik Community
- :
- All Forums
- :
- QlikView App Dev
- :
- Re: 100% stacked bar chart
- Subscribe to RSS Feed
- Mark Topic as New
- Mark Topic as Read
- Float this Topic for Current User
- Bookmark
- Subscribe
- Mute
- Printer Friendly Page
- Mark as New
- Bookmark
- Subscribe
- Mute
- Subscribe to RSS Feed
- Permalink
- Report Inappropriate Content
100% stacked bar chart
Hi everyone,
I'm working on a 100% stacked bar chart.
I found some topics in the community regarding this question:
100% Stacked bar chart in Qlik Sense | Qlik Community
Keywords : TOTAL, ALL & DISTINCT
Regretfully, it doesn't seem to be working in my specific situation.
So, I already created a measure with this expression:
Count([Order Reference Deliveries])/Count(Total <Month> [Order Reference Deliveries])
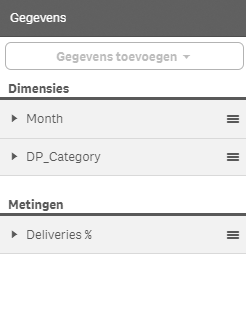
And I created a stacked bar chart with these dimensions/measures:

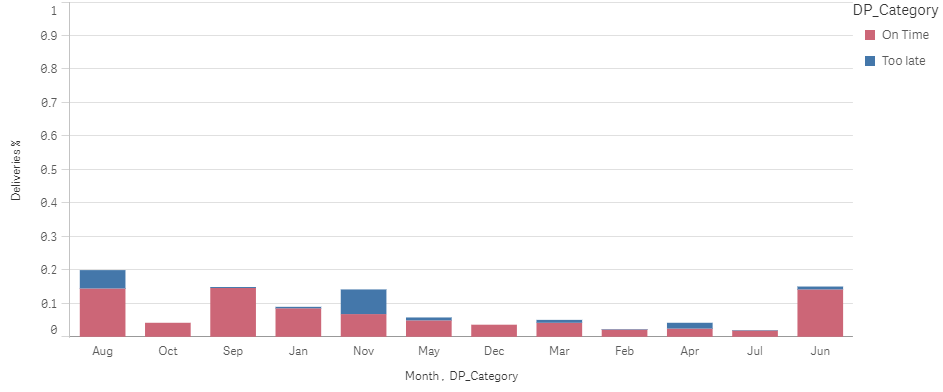
This is the result:

So.... what am I doing wrong?
- « Previous Replies
-
- 1
- 2
- Next Replies »
- Mark as New
- Bookmark
- Subscribe
- Mute
- Subscribe to RSS Feed
- Permalink
- Report Inappropriate Content
Try this as your color expression
If(Only({$<IsR24M={1}>} DP_Category) = 'Too late', RGB(131,208,245),
If(Only({$<IsR24M={1}>} DP_Category) = 'On time', RGB(0,108,183)))
- Mark as New
- Bookmark
- Subscribe
- Mute
- Subscribe to RSS Feed
- Permalink
- Report Inappropriate Content
Works like a charm, thank you very much!

- Mark as New
- Bookmark
- Subscribe
- Mute
- Subscribe to RSS Feed
- Permalink
- Report Inappropriate Content
Hi, I have the same issue but I am not sure how to correct. The 100% stacked chart is accumulating the months instead of showing individually.
How can I correct this
- Mark as New
- Bookmark
- Subscribe
- Mute
- Subscribe to RSS Feed
- Permalink
- Report Inappropriate Content
hi sunny, i have similar issue.
From the below data table, im trying to make a 100% stacked chart. But the condition is it would be only for the year 2020.
| Year | Month | Produ | Units |
| 2019 | Jan | A | 5 |
| 2019 | Feb | A | 10 |
| 2019 | Mar | A | 20 |
| 2019 | Jan | B | 5 |
| 2019 | Feb | B | 14 |
| 2019 | Mar | B | 13 |
| 2019 | Jan | C | 7 |
| 2019 | Feb | C | 8 |
| 2019 | Mar | C | 9 |
| 2020 | Jan | A | 5 |
| 2020 | Feb | A | 10 |
| 2020 | Mar | A | 20 |
| 2020 | Jan | B | 5 |
| 2020 | Feb | B | 14 |
| 2020 | Mar | B | 13 |
| 2020 | Jan | C | 7 |
| 2020 | Feb | C | 8 |
| 2020 | Mar | C | 9 |
Im using the below expression:
(Sum([Sellout Qty])/Sum( Total <Month> [Sellout Qty]))
but am not able to condition it to the year 2020 only .
Pl help.
- « Previous Replies
-
- 1
- 2
- Next Replies »