Unlock a world of possibilities! Login now and discover the exclusive benefits awaiting you.
- Qlik Community
- :
- All Forums
- :
- QlikView App Dev
- :
- Re: 12 months moving average just for 1 season
- Subscribe to RSS Feed
- Mark Topic as New
- Mark Topic as Read
- Float this Topic for Current User
- Bookmark
- Subscribe
- Mute
- Printer Friendly Page
- Mark as New
- Bookmark
- Subscribe
- Mute
- Subscribe to RSS Feed
- Permalink
- Report Inappropriate Content
12 months moving average just for 1 season
Hi
I am in a bit of a dilemma and I am hoping someone can please help.
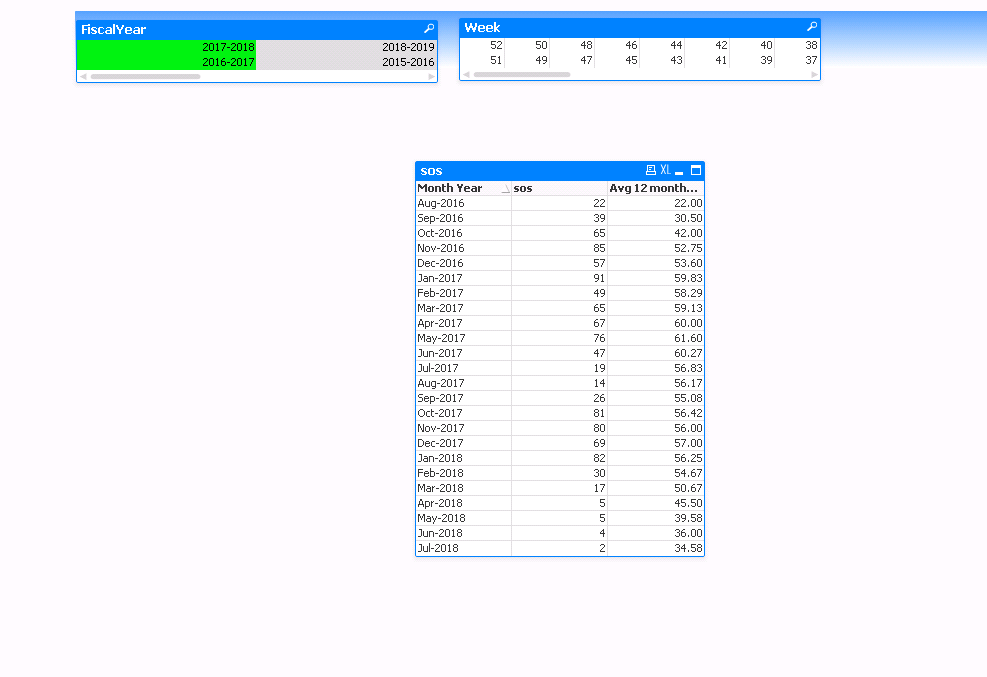
I need to calculate the 12 month moving average for just 1 season,. Each season is from Aug to Jul.
I am using the formula to get the moving avg.
rangeavg(above(COUNT( DISTINCT [Document No.]),0,12))
If I select Fiscal Years 2016-2017 and 2017-2018, I get the right numbers.
However, I only need to display the numbers for this season (Aug-2017 onwards).
Can someone please help.
Thanks

Accepted Solutions
- Mark as New
- Bookmark
- Subscribe
- Mute
- Subscribe to RSS Feed
- Permalink
- Report Inappropriate Content
Try something like:
Sum(Aggr(rangeavg(above(COUNT( {<FiscalYear>} DISTINCT [Document No.]),0,12)), [Month Year]))
If this doesn't help, try to share your sample qvw.
- Mark as New
- Bookmark
- Subscribe
- Mute
- Subscribe to RSS Feed
- Permalink
- Report Inappropriate Content
You need to work with
The As-Of Table OR Fiscal Year Fiscal and Standard Calendar generation
- Mark as New
- Bookmark
- Subscribe
- Mute
- Subscribe to RSS Feed
- Permalink
- Report Inappropriate Content
Try something like:
Sum(Aggr(rangeavg(above(COUNT( {<FiscalYear>} DISTINCT [Document No.]),0,12)), [Month Year]))
If this doesn't help, try to share your sample qvw.
- Mark as New
- Bookmark
- Subscribe
- Mute
- Subscribe to RSS Feed
- Permalink
- Report Inappropriate Content
May be this
RangeAvg(Above(Count({<FiscalYear>} DISTINCT [Document No.]), 0, 12)) * Avg({<FiscalYear = {"$(=MaxString(FiscalYear))"}>}1)
- Mark as New
- Bookmark
- Subscribe
- Mute
- Subscribe to RSS Feed
- Permalink
- Report Inappropriate Content
That worked. thanks!