Unlock a world of possibilities! Login now and discover the exclusive benefits awaiting you.
- Qlik Community
- :
- All Forums
- :
- QlikView App Dev
- :
- 2 conditions color for bar graph (positive/negativ...
- Subscribe to RSS Feed
- Mark Topic as New
- Mark Topic as Read
- Float this Topic for Current User
- Bookmark
- Subscribe
- Mute
- Printer Friendly Page
- Mark as New
- Bookmark
- Subscribe
- Mute
- Subscribe to RSS Feed
- Permalink
- Report Inappropriate Content
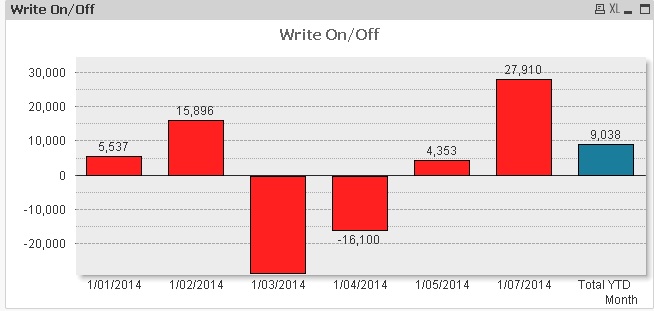
2 conditions color for bar graph (positive/negative AND total bar)
Hi,
In a bar graph, how can I have different colors for positive and negative values AND at the same time have a different color for the Total bar?
Thanks.
- Tags:
- new_to_qlikview
- « Previous Replies
-
- 1
- 2
- Next Replies »
- Mark as New
- Bookmark
- Subscribe
- Mute
- Subscribe to RSS Feed
- Permalink
- Report Inappropriate Content
Hi,
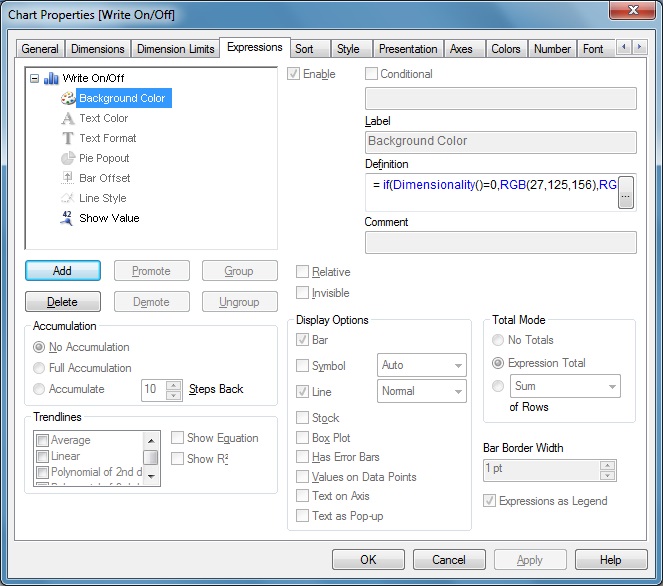
In the expression tab: expand + sign of expression and define the desired color in background of expression.
you can use RGB() for specific color.
HTH
Sushil
- Mark as New
- Bookmark
- Subscribe
- Mute
- Subscribe to RSS Feed
- Permalink
- Report Inappropriate Content
I'm in the tab (for Background color) using IF conditions and RGB function but don't manage to obtain the right result... I don't use If condition correctly I think...
= if(Dimensionality()=0,RGB(27,125,156),
if([Dim]>=0,RGB(255,0,0),RGB(0,185,0))
- Mark as New
- Bookmark
- Subscribe
- Mute
- Subscribe to RSS Feed
- Permalink
- Report Inappropriate Content
Try to use expression in your if condition ..
say your expression is sum(values) then
=if(sum(Values)>=0,RGB(255,0,0),RGB(0,185,0))
- Mark as New
- Bookmark
- Subscribe
- Mute
- Subscribe to RSS Feed
- Permalink
- Report Inappropriate Content
Hi,
Dont use Dimensionality() it servers for different prupose.
Write your expresssion which calculating +,- value in if clause
Like this
IF(Your expression>0,RGB(27,125,156),RGB(255,0,0))
Regards,
Please appreciate our Qlik community members by giving Kudos for sharing their time for your query. If your query is answered, please mark the topic as resolved 🙂
- Mark as New
- Bookmark
- Subscribe
- Mute
- Subscribe to RSS Feed
- Permalink
- Report Inappropriate Content
That works well to have different color for positive and negative values. But I don't manage to change (on top of that) the color of my total bar... (I manage to do one or the other but not both at the same time...)
- Mark as New
- Bookmark
- Subscribe
- Mute
- Subscribe to RSS Feed
- Permalink
- Report Inappropriate Content
I'd like to have green for positive Value, Red for negative value and Blue for the total bar on the right....
Thanks again for your support...
- Mark as New
- Bookmark
- Subscribe
- Mute
- Subscribe to RSS Feed
- Permalink
- Report Inappropriate Content
Hi,
what is your expression?
can you share sample file?
Regards,
Please appreciate our Qlik community members by giving Kudos for sharing their time for your query. If your query is answered, please mark the topic as resolved 🙂
- Mark as New
- Bookmark
- Subscribe
- Mute
- Subscribe to RSS Feed
- Permalink
- Report Inappropriate Content
- Mark as New
- Bookmark
- Subscribe
- Mute
- Subscribe to RSS Feed
- Permalink
- Report Inappropriate Content
Hi,
can you tell us what is your expression which gives your +,- Values
Not your Background expression.
Also check in Help menu.what is use of Dimensionality()
It returns
number of dimension columns that have non-aggregation content. i.e. do not
contain partial sums or collapsed aggregates
Regards,
Please appreciate our Qlik community members by giving Kudos for sharing their time for your query. If your query is answered, please mark the topic as resolved 🙂
- « Previous Replies
-
- 1
- 2
- Next Replies »