Unlock a world of possibilities! Login now and discover the exclusive benefits awaiting you.
- Qlik Community
- :
- All Forums
- :
- QlikView App Dev
- :
- Re: 2 dimension in Line Chart - Date and Hour
- Subscribe to RSS Feed
- Mark Topic as New
- Mark Topic as Read
- Float this Topic for Current User
- Bookmark
- Subscribe
- Mute
- Printer Friendly Page
- Mark as New
- Bookmark
- Subscribe
- Mute
- Subscribe to RSS Feed
- Permalink
- Report Inappropriate Content
2 dimension in Line Chart - Date and Hour
HI Community.
I have a problem, i hope u can help me.
I have this fields.
- Date
- Hour
- Quantity
- Station
When i use dimension Date or Hour with "Station" and sum qunatity, the chart its OK
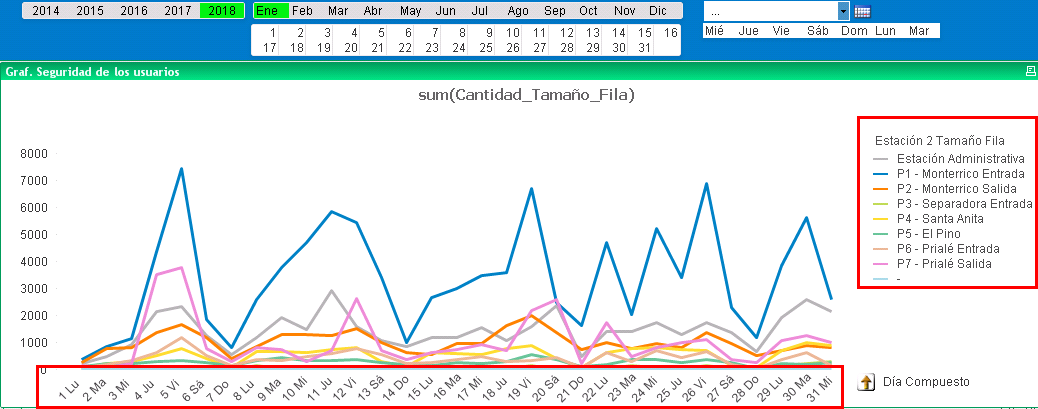
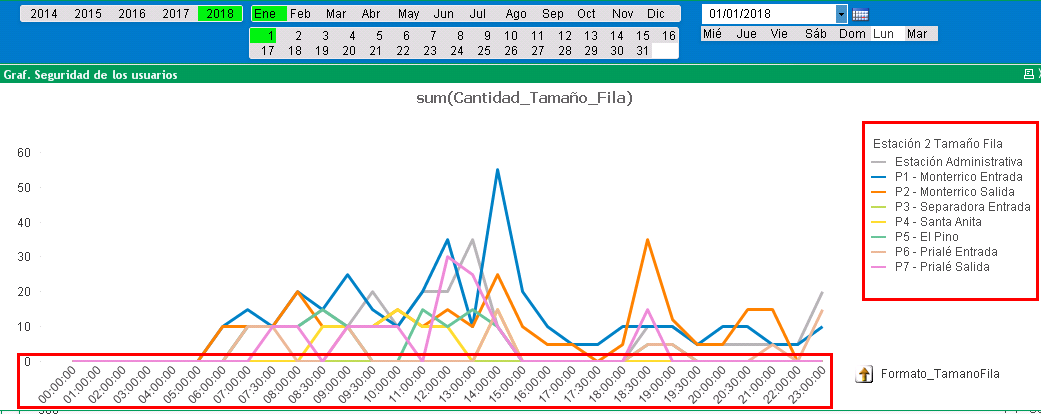
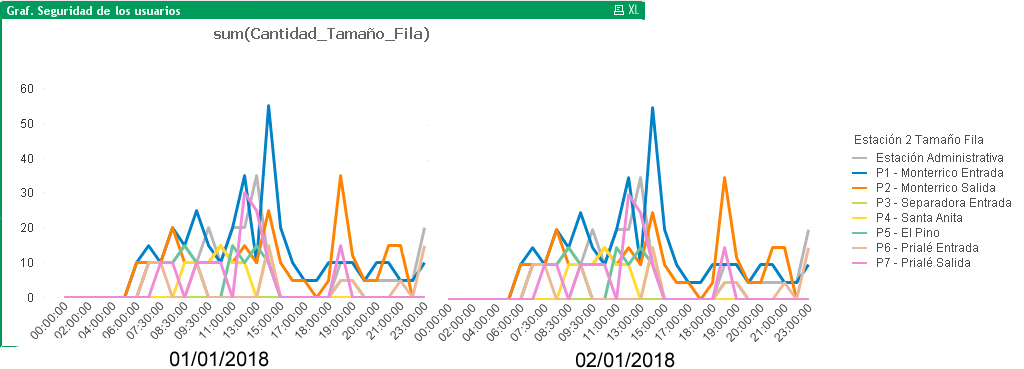
What I need is to group the hours for each day in the same Line Chart. I would like to do something like that...
ACtually, if i select a month, I see just the 23 hours for all the month and i wanna see por each day.
Thanks.
José V.
- Mark as New
- Bookmark
- Subscribe
- Mute
- Subscribe to RSS Feed
- Permalink
- Report Inappropriate Content
What do you see if you take first dimension as Date and the next dimension as hour?
- Mark as New
- Bookmark
- Subscribe
- Mute
- Subscribe to RSS Feed
- Permalink
- Report Inappropriate Content
You need to create a new field and use a single dimension for this chart
Create a new field as and use this in the chart
TimeStamp(DateField &' '& Timefield, 'whatever the format') as DateTimeStamp,
If a post helps to resolve your issue, please accept it as a Solution.
- Mark as New
- Bookmark
- Subscribe
- Mute
- Subscribe to RSS Feed
- Permalink
- Report Inappropriate Content
you can also refer this post to create the timestamp
https://community.qlikview.com/thread/69389
If a post helps to resolve your issue, please accept it as a Solution.
- Mark as New
- Bookmark
- Subscribe
- Mute
- Subscribe to RSS Feed
- Permalink
- Report Inappropriate Content
If I do that.... i cant see the "station"
I wanna see each date with the group of hour...........
- Mark as New
- Bookmark
- Subscribe
- Mute
- Subscribe to RSS Feed
- Permalink
- Report Inappropriate Content
Hi Vineeth.
I try with timestamp, but the field Date, show me like a number. the hour is ok but date its a problem
I used that
=TimeStamp#(Fecha &'-'& Formato_TamanoFila,'DD.MM.YYYY hh:mm')
WHere should i put this code? in a dimension rigth?
- Mark as New
- Bookmark
- Subscribe
- Mute
- Subscribe to RSS Feed
- Permalink
- Report Inappropriate Content
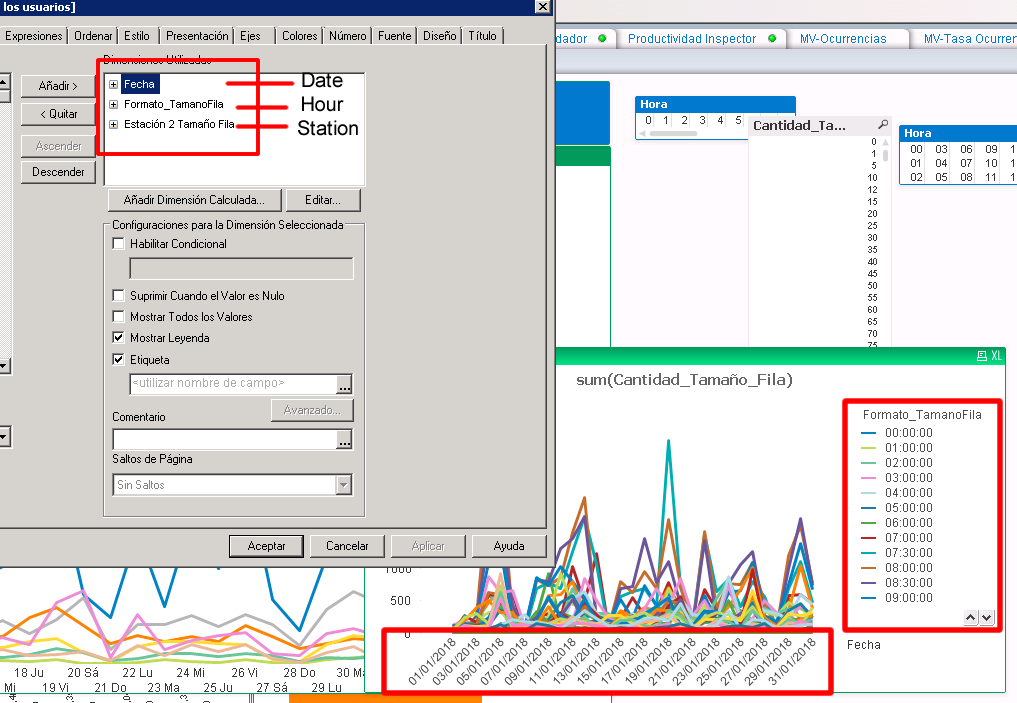
I try with this code in dimension:
=Timestamp(Date#(Fecha,'DD-MM-YYYY') & ' ' & Time#(Formato_TamanoFila,'hh:mm:ss'), 'DD-MM-YYYY hh:mm:ss')
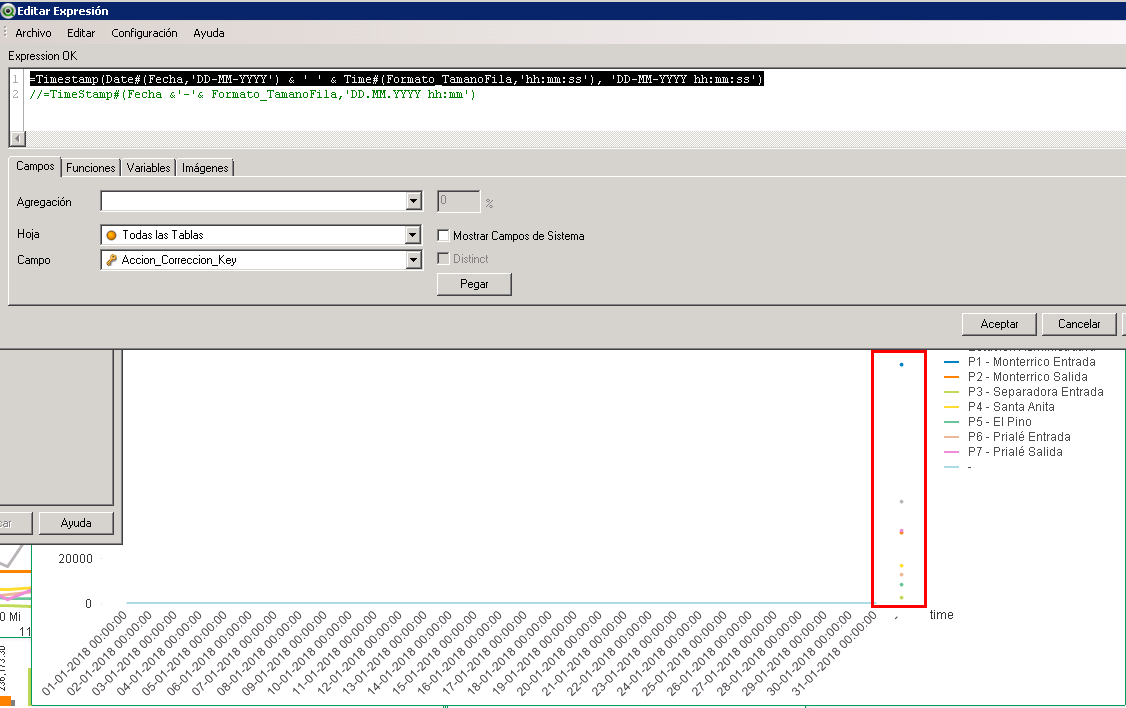
Now i can see the date and hour together... but, the sum of quantity dont work for this field (time-hour).
Anyonw know how to solve that??'
Thank.
- Mark as New
- Bookmark
- Subscribe
- Mute
- Subscribe to RSS Feed
- Permalink
- Report Inappropriate Content
I cant find the solution. I try to explain better.
I have 2 table that i load like a dimension through script.
Dim_Hora --> come from my table Hour
LOAD
Hora_Key,
Formato,
Hora,
Minuto,
Segundo
FROM $(cRutaDatosQVD_Dimensiones)RE_Dim_Hora.qvd(qvd);
Dim_Date --> come from my table Date
LOAD
Tiempo_key,
date(Fecha,'DD/MM/YYYY') as Fecha,
NumDiaSemana,
left(NombreDiaSemana,3) as [Día Semana],
NumDiaMes as [Día]
FROM $(cRutaDatosQVD_Dimensiones)RE_Dim_Tiempo.qvd(qvd);
My Fact QueueSize come from my table QueueSize
LOAD
'AV_Fact_Tamano_Fila_A' as [Tipo_Fact_Key],
Tiempo_key,
Estacion_Key as Station,
Hora_Key,
Cantidad as Quantity
FROM $(cRutaDatosQVD_Hechos)AV_Fact_Tamano_Fila_A.qvd(qvd);
So, I need to agrupate in a Line Chart 2 fields in on dimension. the field Fecha (from Dim_Date) and the field Formato (from Dim_Hour)

- Mark as New
- Bookmark
- Subscribe
- Mute
- Subscribe to RSS Feed
- Permalink
- Report Inappropriate Content
Create a new field based on your requirement and use it in dimension