Unlock a world of possibilities! Login now and discover the exclusive benefits awaiting you.
- Qlik Community
- :
- All Forums
- :
- QlikView App Dev
- :
- Re: 3 month count for the products demo'd
- Subscribe to RSS Feed
- Mark Topic as New
- Mark Topic as Read
- Float this Topic for Current User
- Bookmark
- Subscribe
- Mute
- Printer Friendly Page
- Mark as New
- Bookmark
- Subscribe
- Mute
- Subscribe to RSS Feed
- Permalink
- Report Inappropriate Content
3 month count for the products demo'd
Hi All, I am trying to create a 3 month count for the various products that have been demo'd. Eg. If month selected is 'Aug', then the count would be for the months - Jun, Jul, Aug. I do not want it to be a distinct count. Could anybody please help me with it. Its really urgent. Must finish the report by Friday!# I tried using the Rangecount() with Aggr() but it provides distinct values. I tried set analysis using a variable but again I am unable to get the desired value. Your help is much appreciated.
- Tags:
- new_to_qlikview
- Mark as New
- Bookmark
- Subscribe
- Mute
- Subscribe to RSS Feed
- Permalink
- Report Inappropriate Content
Hi Sneha,
Is this something similar to what you are looking for?
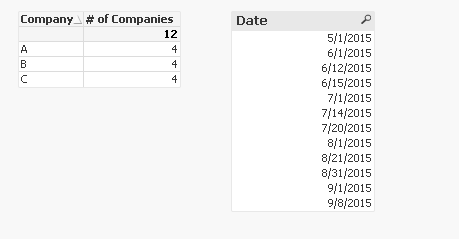
If I choose a date from the date list box, the table only will show the number of companies within 3 months of selected date:
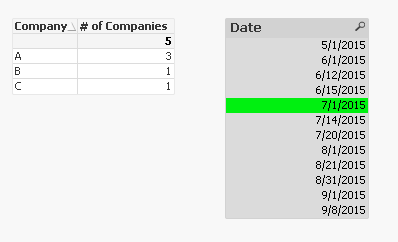
The expression I used:

Hope this helps.
- Mark as New
- Bookmark
- Subscribe
- Mute
- Subscribe to RSS Feed
- Permalink
- Report Inappropriate Content
Hi Sinan, In theory Yes, I am looking for something similar. My month field displays values as 'Aug, Apr' so can I use getfieldselected() here to do identify the past 3 months?? I want to be able to select a month and then create a chart with values for 3 months.
Thanks for your help
- Mark as New
- Bookmark
- Subscribe
- Mute
- Subscribe to RSS Feed
- Permalink
- Report Inappropriate Content
Hi Sneha,
You may need to add the below script to load script:

And then in your expression, you can write something like the below:

I am attaching the sample qvw in case you need it.
Hope this helps.
- Mark as New
- Bookmark
- Subscribe
- Mute
- Subscribe to RSS Feed
- Permalink
- Report Inappropriate Content
Hi Sinan, Your formula does work, but the problem I have is that it still gives a months data and not for 3 months. I am so not understanding where I am going wrong. Count(products) gives the same value as your formula. What can I do next?
- Mark as New
- Bookmark
- Subscribe
- Mute
- Subscribe to RSS Feed
- Permalink
- Report Inappropriate Content
Would you mind sending some sample data?
I cannot open an app so that's why I said just some sample data.
Thanks