Unlock a world of possibilities! Login now and discover the exclusive benefits awaiting you.
- Qlik Community
- :
- All Forums
- :
- QlikView App Dev
- :
- Re: 3d bar graphs
- Subscribe to RSS Feed
- Mark Topic as New
- Mark Topic as Read
- Float this Topic for Current User
- Bookmark
- Subscribe
- Mute
- Printer Friendly Page
- Mark as New
- Bookmark
- Subscribe
- Mute
- Subscribe to RSS Feed
- Permalink
- Report Inappropriate Content
3d bar graphs
Hey guys
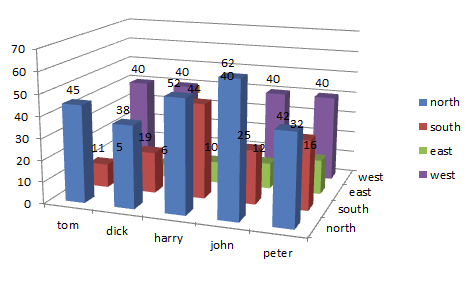
is it possible to create 3d bar graphs like the one in the atached file?
I have tried but failed to find a way.
appriciate any help
- Tags:
- new_to_qlikview
- « Previous Replies
-
- 1
- 2
- Next Replies »
- Mark as New
- Bookmark
- Subscribe
- Mute
- Subscribe to RSS Feed
- Permalink
- Report Inappropriate Content
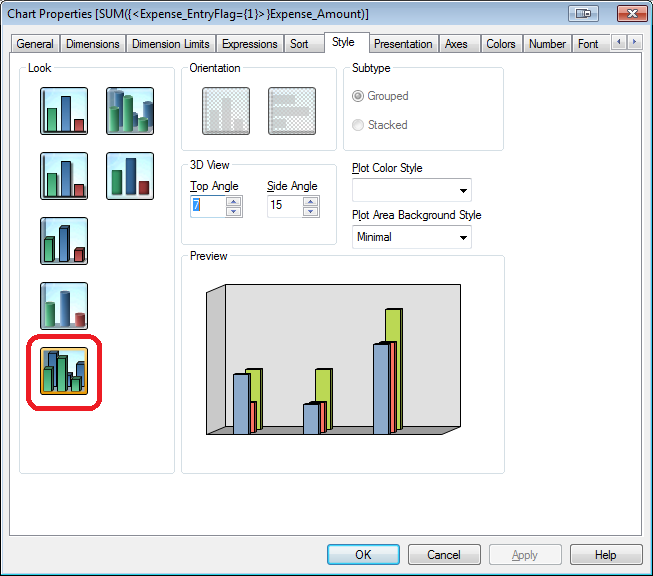
Here is the option you need. I would recommend not using this type of representation if you can help it though because it is hard to compare the values. For example in your pic above, you can't tell what the value for Tom/East is.
- Mark as New
- Bookmark
- Subscribe
- Mute
- Subscribe to RSS Feed
- Permalink
- Report Inappropriate Content
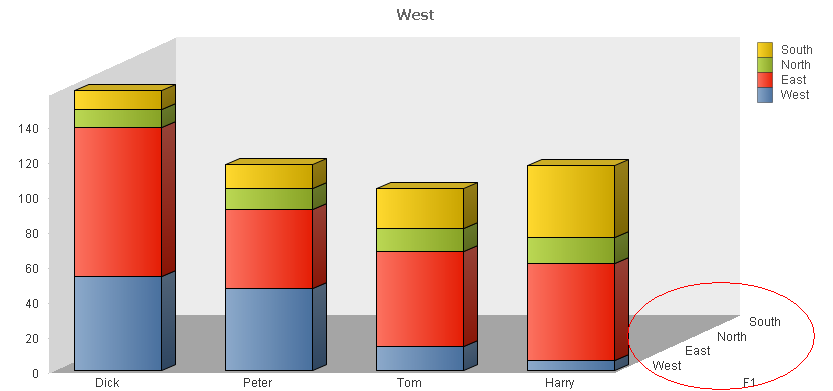
when I try that I get the following chart.
This is very weird because the chart is stacked but you can see the West, East, North and South (circled) with no values.
- Mark as New
- Bookmark
- Subscribe
- Mute
- Subscribe to RSS Feed
- Permalink
- Report Inappropriate Content
Yeah, thats a little strange. Is either the name or the direction set up as an expression? Because you will only get the proper rendering with two dimensions and one expression.
- Mark as New
- Bookmark
- Subscribe
- Mute
- Subscribe to RSS Feed
- Permalink
- Report Inappropriate Content
this is my table that I am using to produce the above chart.
| North | South | East | West | |
| Tom | 13 | 23 | 54 | 14 |
| Dick | 10 | 11 | 85 | 54 |
| Harry | 15 | 41 | 55 | 6 |
| Peter | 12 | 14 | 45 | 47 |
- Mark as New
- Bookmark
- Subscribe
- Mute
- Subscribe to RSS Feed
- Permalink
- Report Inappropriate Content
As I said earlier, the problem is that you use one dimension and three expressions, while you should use 2 dimensions and one expression.
Convert your data in a form:
An Personn Percent
A1 Person1 12%
...
Then use first two as a dimension and Percent as an expression.
- Mark as New
- Bookmark
- Subscribe
- Mute
- Subscribe to RSS Feed
- Permalink
- Report Inappropriate Content
OK, so you need to crosstable that data so that your table looks more like below. Your values should be in a single column so that way you only need one expression to report on them. I have attached the qvw as example. Hopefully that makes sense.
| Name | Region | Value |
|---|---|---|
| Dick | East | 85 |
| Dick | North | 10 |
| Dick | South | 11 |
| Dick | West | 54 |
| Harry | East | 55 |
| Harry | North | 15 |
| Harry | South | 41 |
| Harry | West | 6 |
| Peter | East | 45 |
| Peter | North | 12 |
| Peter | South | 14 |
| Peter | West | 47 |
| Tom | East | 54 |
| Tom | North | 13 |
| Tom | South | 23 |
| Tom | West | 14 |
- Mark as New
- Bookmark
- Subscribe
- Mute
- Subscribe to RSS Feed
- Permalink
- Report Inappropriate Content
Hi
Try like this,
Dimension: Name and ValueList('North','South','West','East')
Exp:
If(ValueList('North','South','West','East')='North',Sum(North),if(ValueList('North','South','West','East')='South',Sum(South),
if(ValueList('North','South','West','East')='West',Sum(West),Sum(East))))
Hope it helps
Please close the thread by marking correct answer & give likes if you like the post.
- Mark as New
- Bookmark
- Subscribe
- Mute
- Subscribe to RSS Feed
- Permalink
- Report Inappropriate Content
thanks alot guys.
you've given 2 solutions here.
One is to transform the data as shown in Aaron's post.
Second option is to use Mayil's Valuelist with the if expressions above.
I think the better way for me to go about this is to use Mayil's method because then wouldn't have to transform the data.
thanks guys.
- Mark as New
- Bookmark
- Subscribe
- Mute
- Subscribe to RSS Feed
- Permalink
- Report Inappropriate Content
In some cases it's useful to have both representations of data.
Just add East, North, South, West fields to Aaron's table with corresponding values (skipping other region rows with nulls).
In this case you'll have a choice of what approach to use in a particular Chart or Expression.
- « Previous Replies
-
- 1
- 2
- Next Replies »